Energía
As reported last Friday, the Non-Commercial Funds have continued to reduce their net long positions in crude oil. Fund managers tend to concentrate their positions in contracts close to expiration, which are more liquid, so selling pressure has been most pronounced at the front end of the futures curve. Nearby futures prices have fallen more than contracts with deferred expirations. For example, in Chart 1 below the Brent front month has dropped $5 from $84.50 on October 1 (red line) to $79.50 on October 19 (black line). In comparison, in the six months deferred contract prices at 5/30/2029 dropped $4 from $82.50 (red line) to $78.50 (black line). The forward curve has changed from steep backwardation closer to flat.
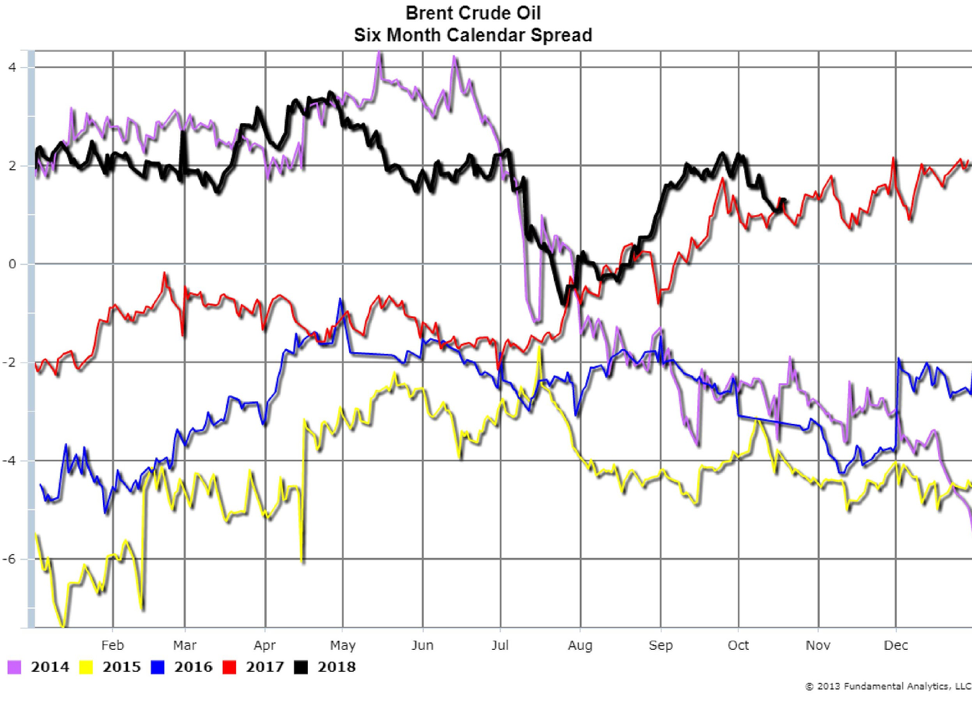
As viewed from Brent’s six-month calendar spread (Chart 2, black line) the spread has decreased from a backwardation of more than $2 per barrel at the start of the October to just over $1 last Friday. In the past, the Brent calendar spread has been a reliable indicator of the supply-demand balance, and the recent softening of the spread is consistent with an improved near-term outlook for global oil supplies.
We recommend considerations of short positions in the crude oil market.
Chart 1
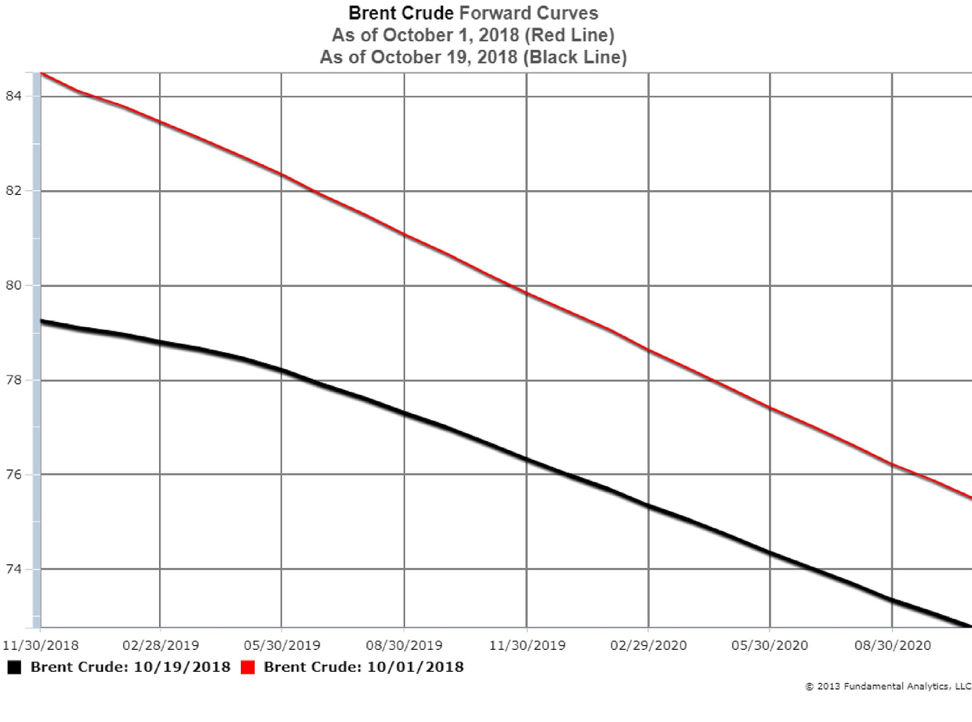
Chart 2
 Grains
Corn
The latest FAS (Foreign Agriculture Statistics) report for the week ending October 11, 2018 reported corn weekly export sales at 382,534 metric tons (Chart 3, orange line). The sales number was well below expectations of 800,000 – 1,300,000 metric tons.
Corn prices dropped in reaction to the poor export sales and news that the harvest was underway. Harvest data as reported by producers still indicate that the corn crop will be very large even with the slow harvest. Producers intend to store as much of the crop as possible as they are not willing to sell at current low prices. With this pressure on prices we suggest consideration of short positions during any price rally in this bear market.
Chart 3

Soybeans
FAS reported soybean export sales at 293,566 metric tons (Chart 4, orange line), also well under the 600,000 – 1,000,000 metric tons expectations, and the lowest in history for this week.
Soybeans prices are lower as the news about demand was bearish to price. In addition to FAS reporting low export sales, Commerce Department secretary Wilbur Ross was quoted as saying that talks between the US and China had stalled. The latest USDA WASDE report showed very strong production and very high ending stocks estimates. Current ending stocks estimates are still more than ample, so it will take major world production problems or a change in the trade attitude with China for improvement in prices. These conditions are very bearish on prices so we recommend consideration of being short outright prices or calendar spreads.
Chart 4
