Our weekly commentaries and updates will remain free until April 22, 2019. Effective April 22, 2019, a subscription will be required in order to receive them. Anyone who signs up before April 30, 2019 will receive a yearly subscription at the discounted rate of $99/yr. Of course, clients of Fundamental Analytics and BlackSummit Financial Group will continue receiving our weekly content for free.
We would be happy to discuss this commentary with you and provide additional market insights. Feel free to call us at +1 859-687-2748 or email us at abram.finley@fundamentalanalytics.com
Monthly Newsletter: April 2019
By Abe Finley and Joel Fingerman
Dear Joel:
Fundamentals
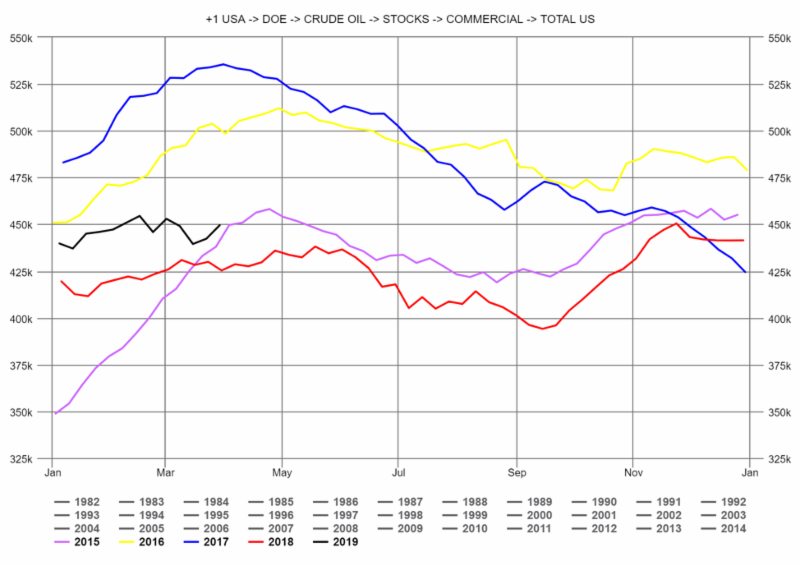
The DOE reported Total Crude Oil Inventories increased by 7.2 million barrels to 449.5 million barrels for the week ending March 29, 2019, while the expectations average was for a 0.4 million barrel draw. The DOE report was a bearish surprise for crude prices, and with the release of the report prices dropped 40 cents but then recovered. Since the beginning of 2019, crude stocks have been range bound between about 440 million barrels and 450 million barrels, so the bearish surprise did not have a large effect on prices. Prices continue to ratchet up to the $62 level.
Chart 1
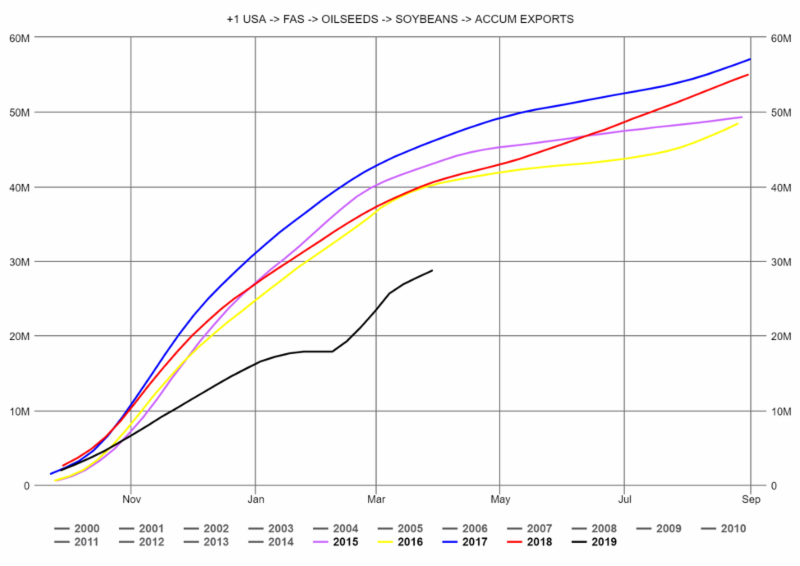
Soybean accumulated exports saw a sharp rise in March (Chart 2, black line); however, accumulated exports remain substantially lower than the previous three years (Chart 2, yellow, red, purple, and blue lines). The low level of accumulated soybean exports can be explained, in part, by the sharp reduction in soybean exports to China in 2018 as a consequence of the US-China trade war. Soybean prices are likely to rise to levels seen in previous years once a resolution has been brought to the trade war.
Chart 2
Platform Potential
The commodity market research platform offered by Fundamental Analytics is intuitive and easy to use. The year-on-year default visualizations of certain pricing and fundamental data along with the ability to easily create spreads charts offer a superb tool for analyzing relevant data. Research by our team in March exemplifies how combined analysis of pricing, spreads and fundamental data can offer meaningful market insights.
Note: The content below reflect updates and commentaries that we send regularly to our distribution lists. Because some time has now passed since its original release, the content below should not be regarded as up-to-date market commentary. If you wish to receive this type of analysis in a timely fashion, please let us know. In addition, you can conduct your own research by subscribing to our research platform. For more information give us a call at (859) 687-2748 or visit www.fundamentalanalytics.com.
Commentary originally from March
Energy
The calendar spread of NYMEX May Crude – NYMEX June Crude for the 2019 contracts has decreased from positive 60 cents last May (Chart 1, black line) to negative 39 cents as of March 5. These calendar spreads of consecutive months are often called “front-to-back” spreads. The value of the front-to-back spreads often is inversely correlated to crude stocks at Cushing, Oklahoma (Chart 2), the delivery point of the NYMEX crude oil contracts. As stocks increase at Cushing, there tends to be downward pressure on the front-to-back spreads. Cushing stocks have been increasing since last August, from 20 million barrels to 47.5 million barrels as of March 1 (Chart 2, red and black lines), and correspondingly the May-June Crude spread has been decreasing. See the Chart 3 scatterplot of this inverse relationship. Should the Cushing stocks continue to increase, as we expect, this will continue to pressure the front-to-back crude calendar spreads.
Summary of market commentary last month
Fundamental Analytics offers timely weekly commentary tied to reporting from the DOE, as well as weekly reports on crude oil and natural gas. We also offer a weekly commodity market update highlighting developments in agricultural and energy markets. If you are interested in receiving any or all of these updates, please let us know. Below are some summaries of our Commodity Market Updates last month.
Note: The content below reflects updates and commentaries that we send regularly to our distribution lists. Because some time has now passed since its original release, the content below should not be regarded as up-to-date market commentary. If you wish to receive this type of analysis in a timely fashion, please let us know. In addition, you can conduct your own research by subscribing to our research platform. For more information please give us a call at (859) 687-2748 or visit www.fundamentalanalytics.com.
March 21
Prior to 2014, crude oil produced in the US could not be exported per federal law. When the law was changed in mid-2014, US crude exports increased to about 0.5 million barrels per day. Starting in mid-2017 with increasing domestic shale production of crude oil, crude exports increased dramatically to 3.39 million barrels per day. With record crude oil production for supply, crude stocks can be at lower levels. With strong exports and lower levels of crude stocks, US WTI crude oil prices will be supported and can be expected to stay above $60 a barrel.
April 4
Since March 6, 2019, front-month crude oil prices have increased more than $6, from $56.22 to $62.46 per barrel. The forward curves for those two dates also show the contango coming out of the market to a primarily backwardated market. As of March 6, the contango was over two dollars from the April contract at $56.22 to the December contract at $58.61. As of April 3, the contango was only nine cents from the May contract at $62.46 to the July contract at $62.55; after that, the forward curve was backwardated. Backwardation supports rising prices, and, in turn, rising prices generally increase backwardation. The forward curves are indicating higher prices.
What to Watch in Upcoming Weeks
Below are a few things to watch in early/mid-April of 2019. These factors are likely to impact energy and agricultural markets.
● Expectations regarding acreage of US corn and soybeans to be planted in 2019
● Volume of Chinese soybean imports
● Geopolitical tensions, such as the fighting between the Libyan government and rebel forces.
● Natural gas prices moving lower as the injection season arrives.
● Crack spreads reflect seasonal factors at the end of Q1 with a substantial gain in the gasoline refining spread and a loss in the heating oil processing spread.