Mid-Week, Weekly Review of Gold, Silver, and Palladium
November 25, 2020
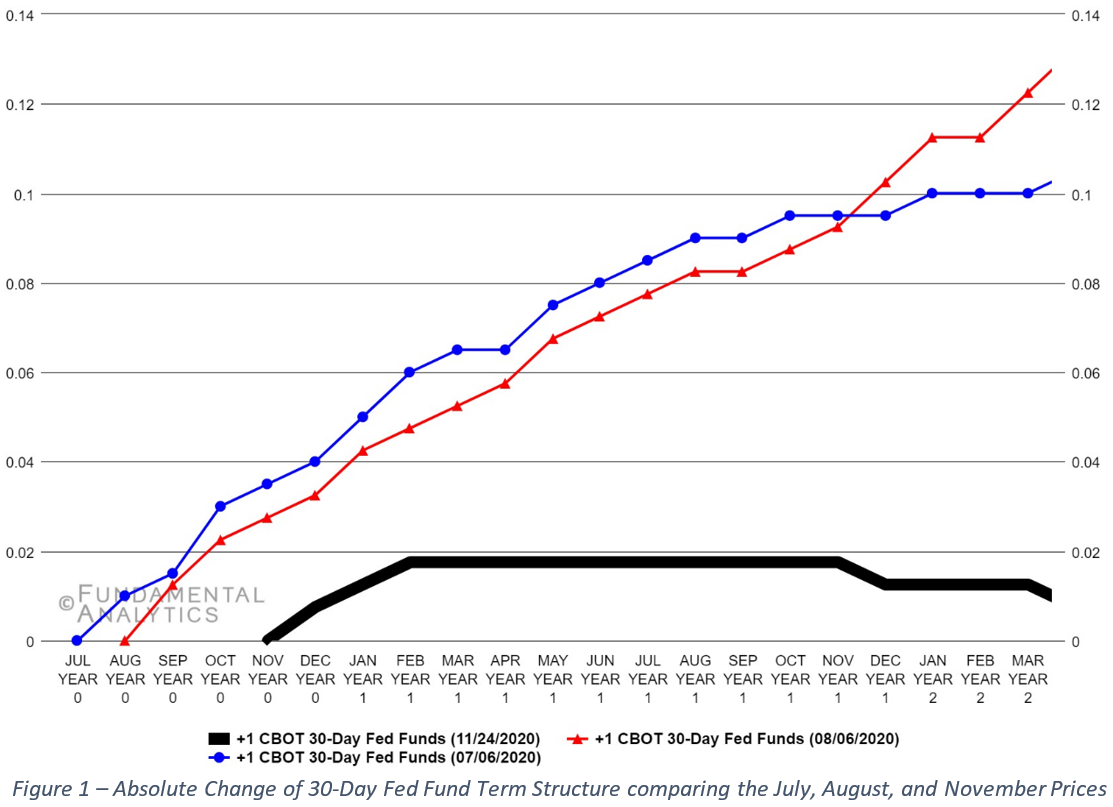
Both gold and silver are being pressured downward with gold breaking below support at $1850 and silver testing support around $23. Some of the pressures are: the Presidential election is over and a winner chosen; the House and Senate both moving more center; multiple COVID vaccines announced (all resulting in more risk on); and a move away from negative rates seen in the CBOT 30-day Fund Term Structure (Figure 1) comparing the July, August and November futures. It should be noted however, these curves are far from ‘normal’ compared to pre-2019.
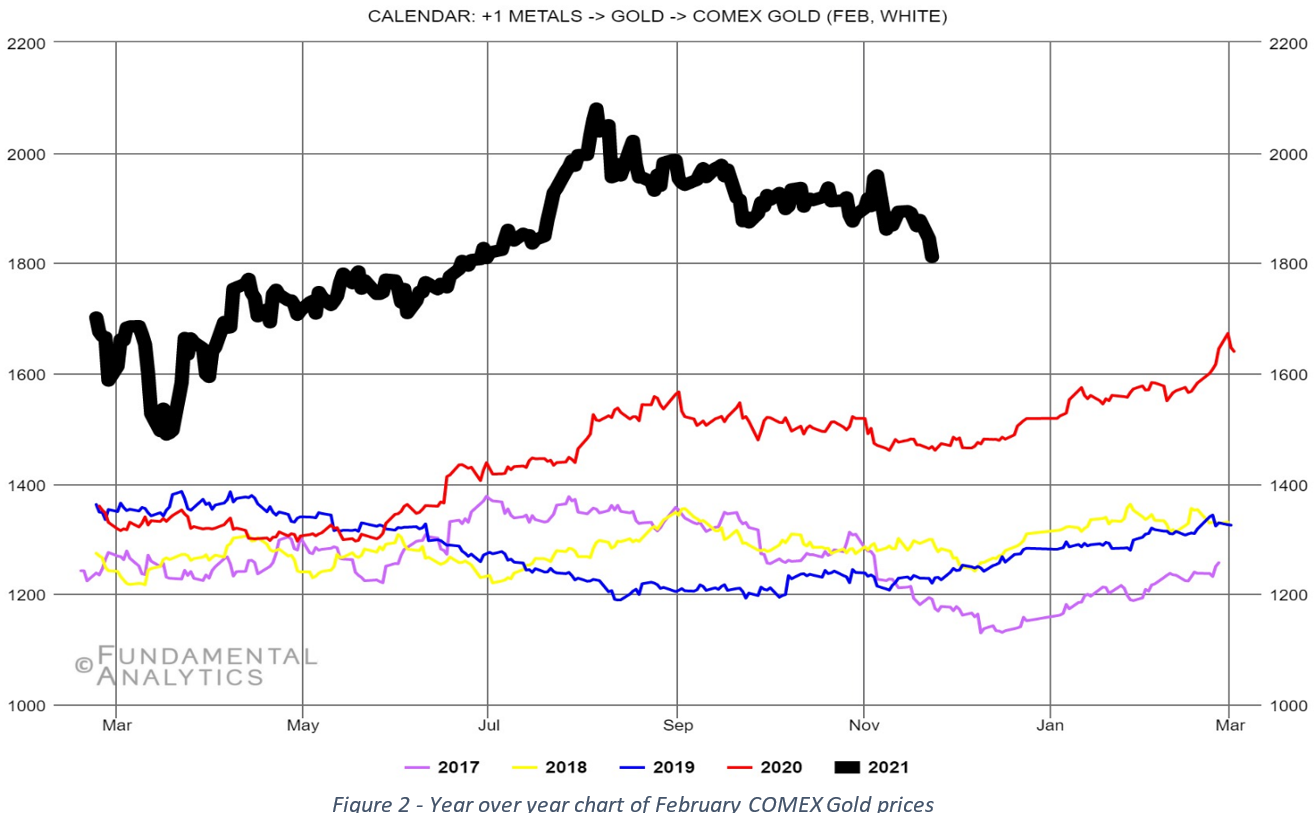
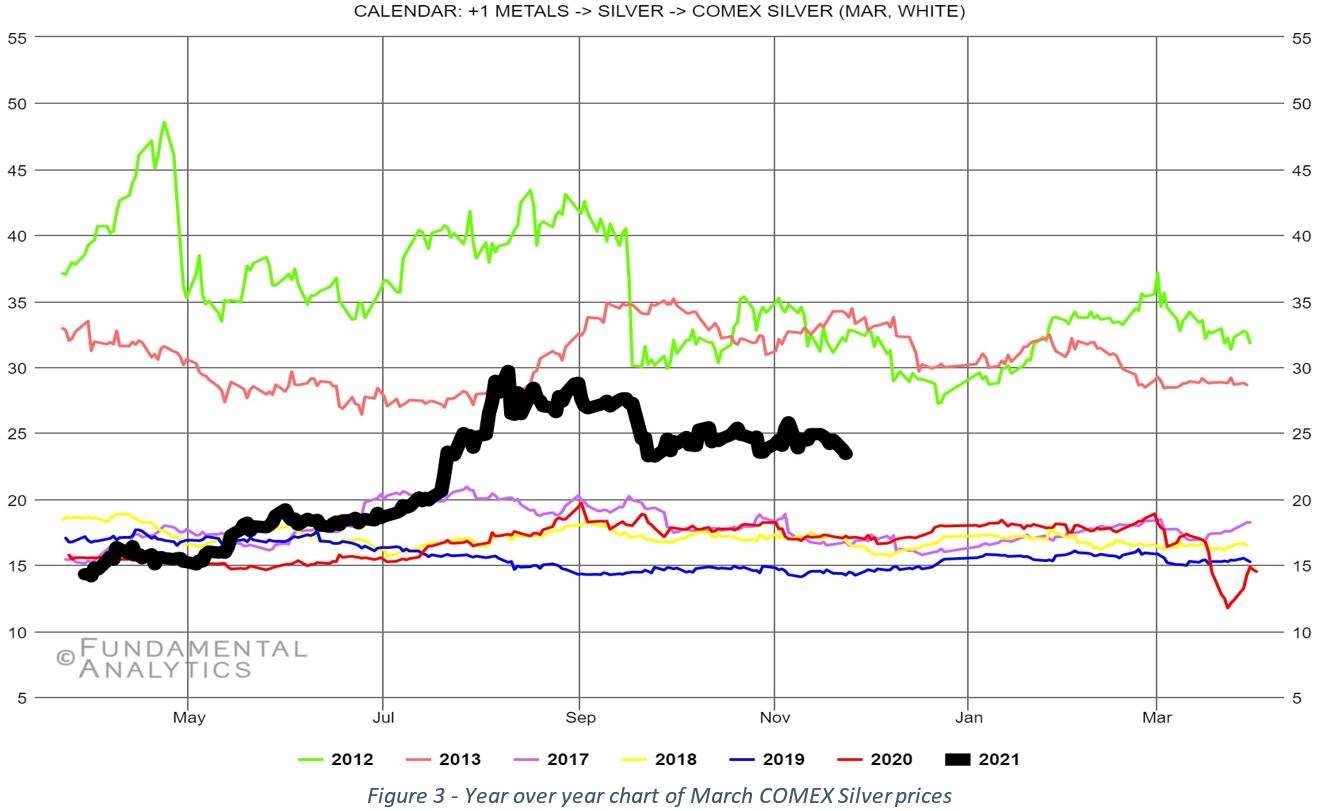
The front month contract for gold and silver were down 4.23% and 5.45% respectively at the close of trading yesterday, with respect to the close on November 17th, 2020. The ratio of the month 1 Gold contract to the month 1 Silver contract is up 1.3% compared to the close on the 17th and essentially moving sideways since the end of September. With the front month gold and silver contracts closing yesterday at $1804.80 and $23.29, respectively, the gold/silver ratio is now 77.5, 17.3% higher than the corresponding 15-year average. February gold (Figure 2) closed yesterday at $1810.90, down 4.25% and March silver (Figure 3) closed at $23.41, down 5.48% from the close on November 17th. It should be noted that much of the December gold contracts have rolled into February, so we have moved to the February gold contract.
From an open interest perspective, gold’s total open interest is unchanged from last week and while holding near levels seen since August, it has increased slightly over the last two weeks as gold has moved lower. This might imply additional shorts are slowly entering the market. The latest CFTC report for gold (11/17) for non-commercial net position of funds show net positions rose this last week driven by an uptick in long positions. Volume on Tuesday was nearly 2x the 50-day SMA.
Now on to silver… Silver total open interest rose 1.0% since last week on November 17th. As with gold, silver volume was up yesterday, nearly 1.5x the 50-day SMA. The latest CFTC data (from November 17) show non-commercials net long positions fell slightly for the first time since mid-October as non-commercial funds are increasing their short positions slightly more than their long positions. All this is occurring while total open interest has been rising since the first part of November.
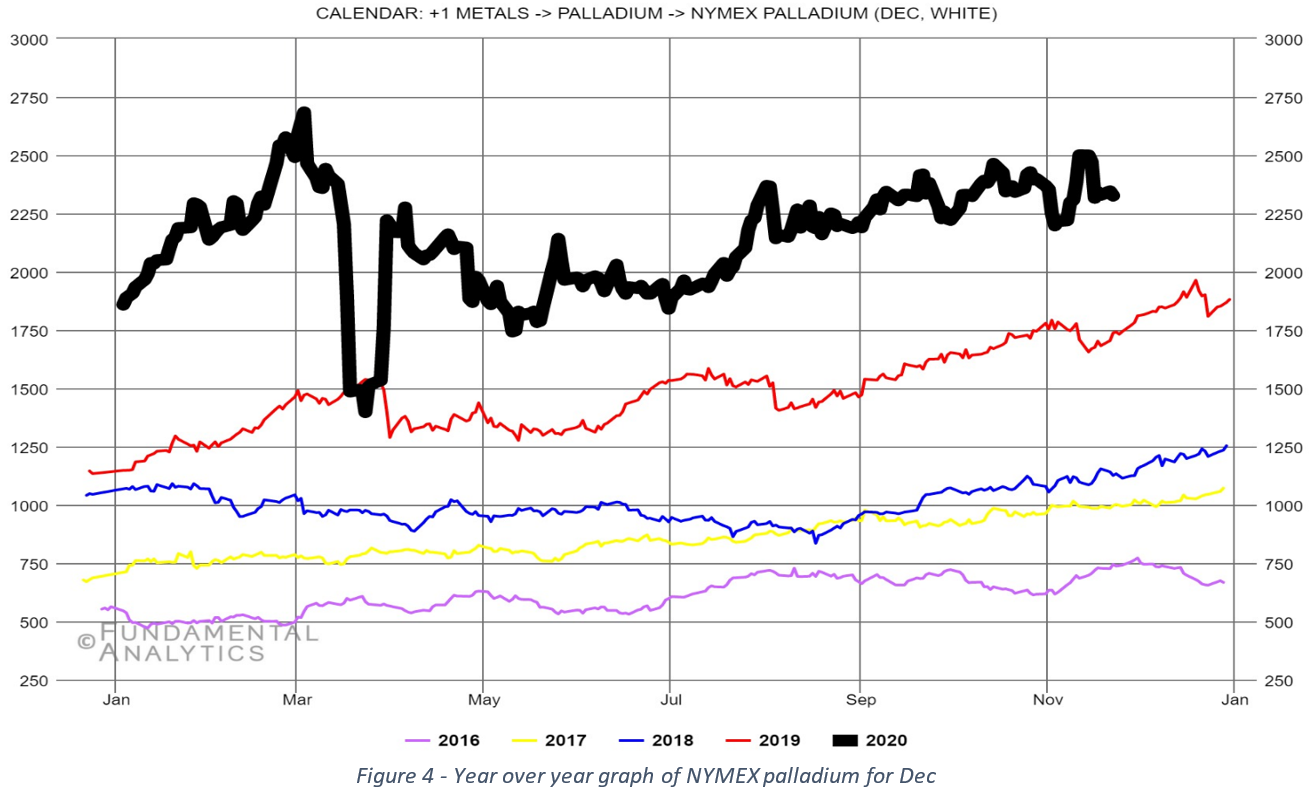
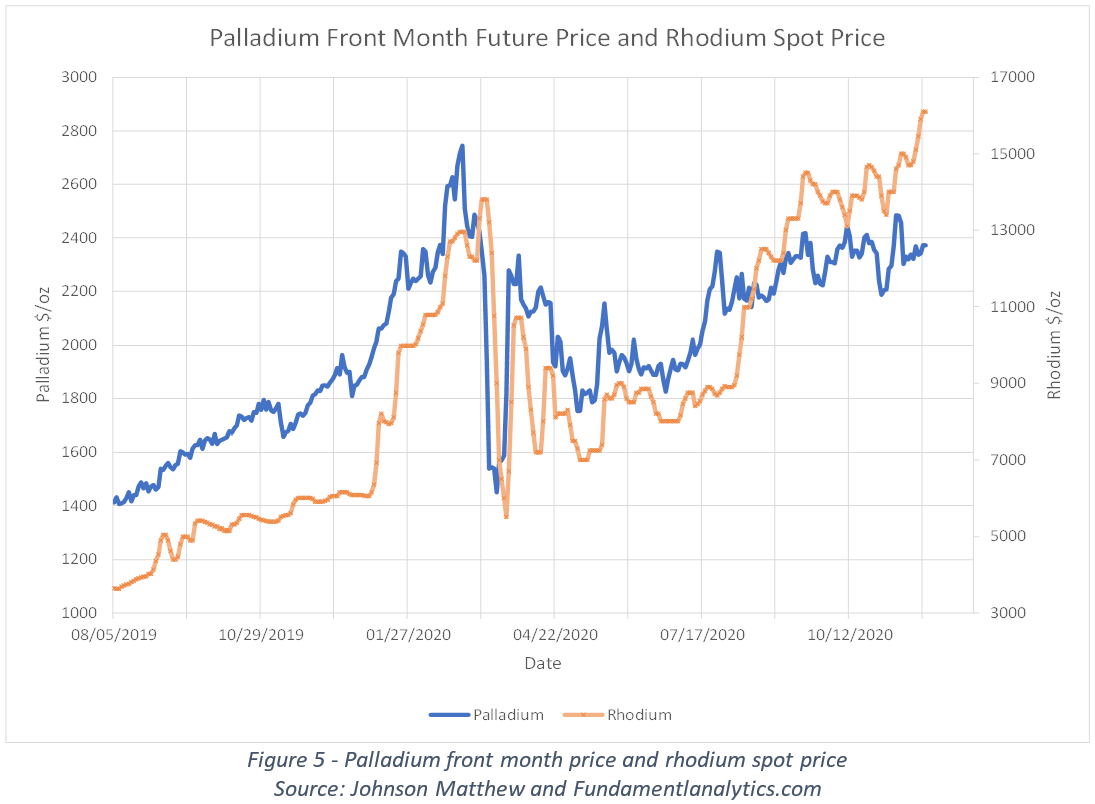
Now for Palladium. March palladium closed at $2371.8 yesterday, up 1.38% from the close last week Tuesday. Total open interest fell 4.9% from Tuesday and with this move it is down 6.6% from two weeks ago. Palladium volume also continues to remain above its 50-day SMA. The November 17th CFTC report showed a 15% decrease in non-commercial net fund positions, but the non-commercial net positions remain on an upward path. Palladium price continues to remain resilient compared to how silver and gold prices are faring. It should be noted rhodium prices continue to rise aggressively which eventually would be expected to impact the price of palladium, as seen in Figure 5.
If you would like access to the great insights and analysis provided by the Fundamental Analytics platform, sign up for a 15-day free trial and demonstration!
If you have any questions, please contact our Technology Manager, Mike Secen at abram.finley@fundamentalanalytics.com
We also invite you to read our other articles and follow us on social media!
Best Regards,
The Fundamental Analytics Team
The information provided here is for general informational purposes only and should not be considered individualized investment advice. All expressions of opinion are subject to change without notice in reaction to shifting market conditions.