Commodity Market Update August 21, 2018
Energy
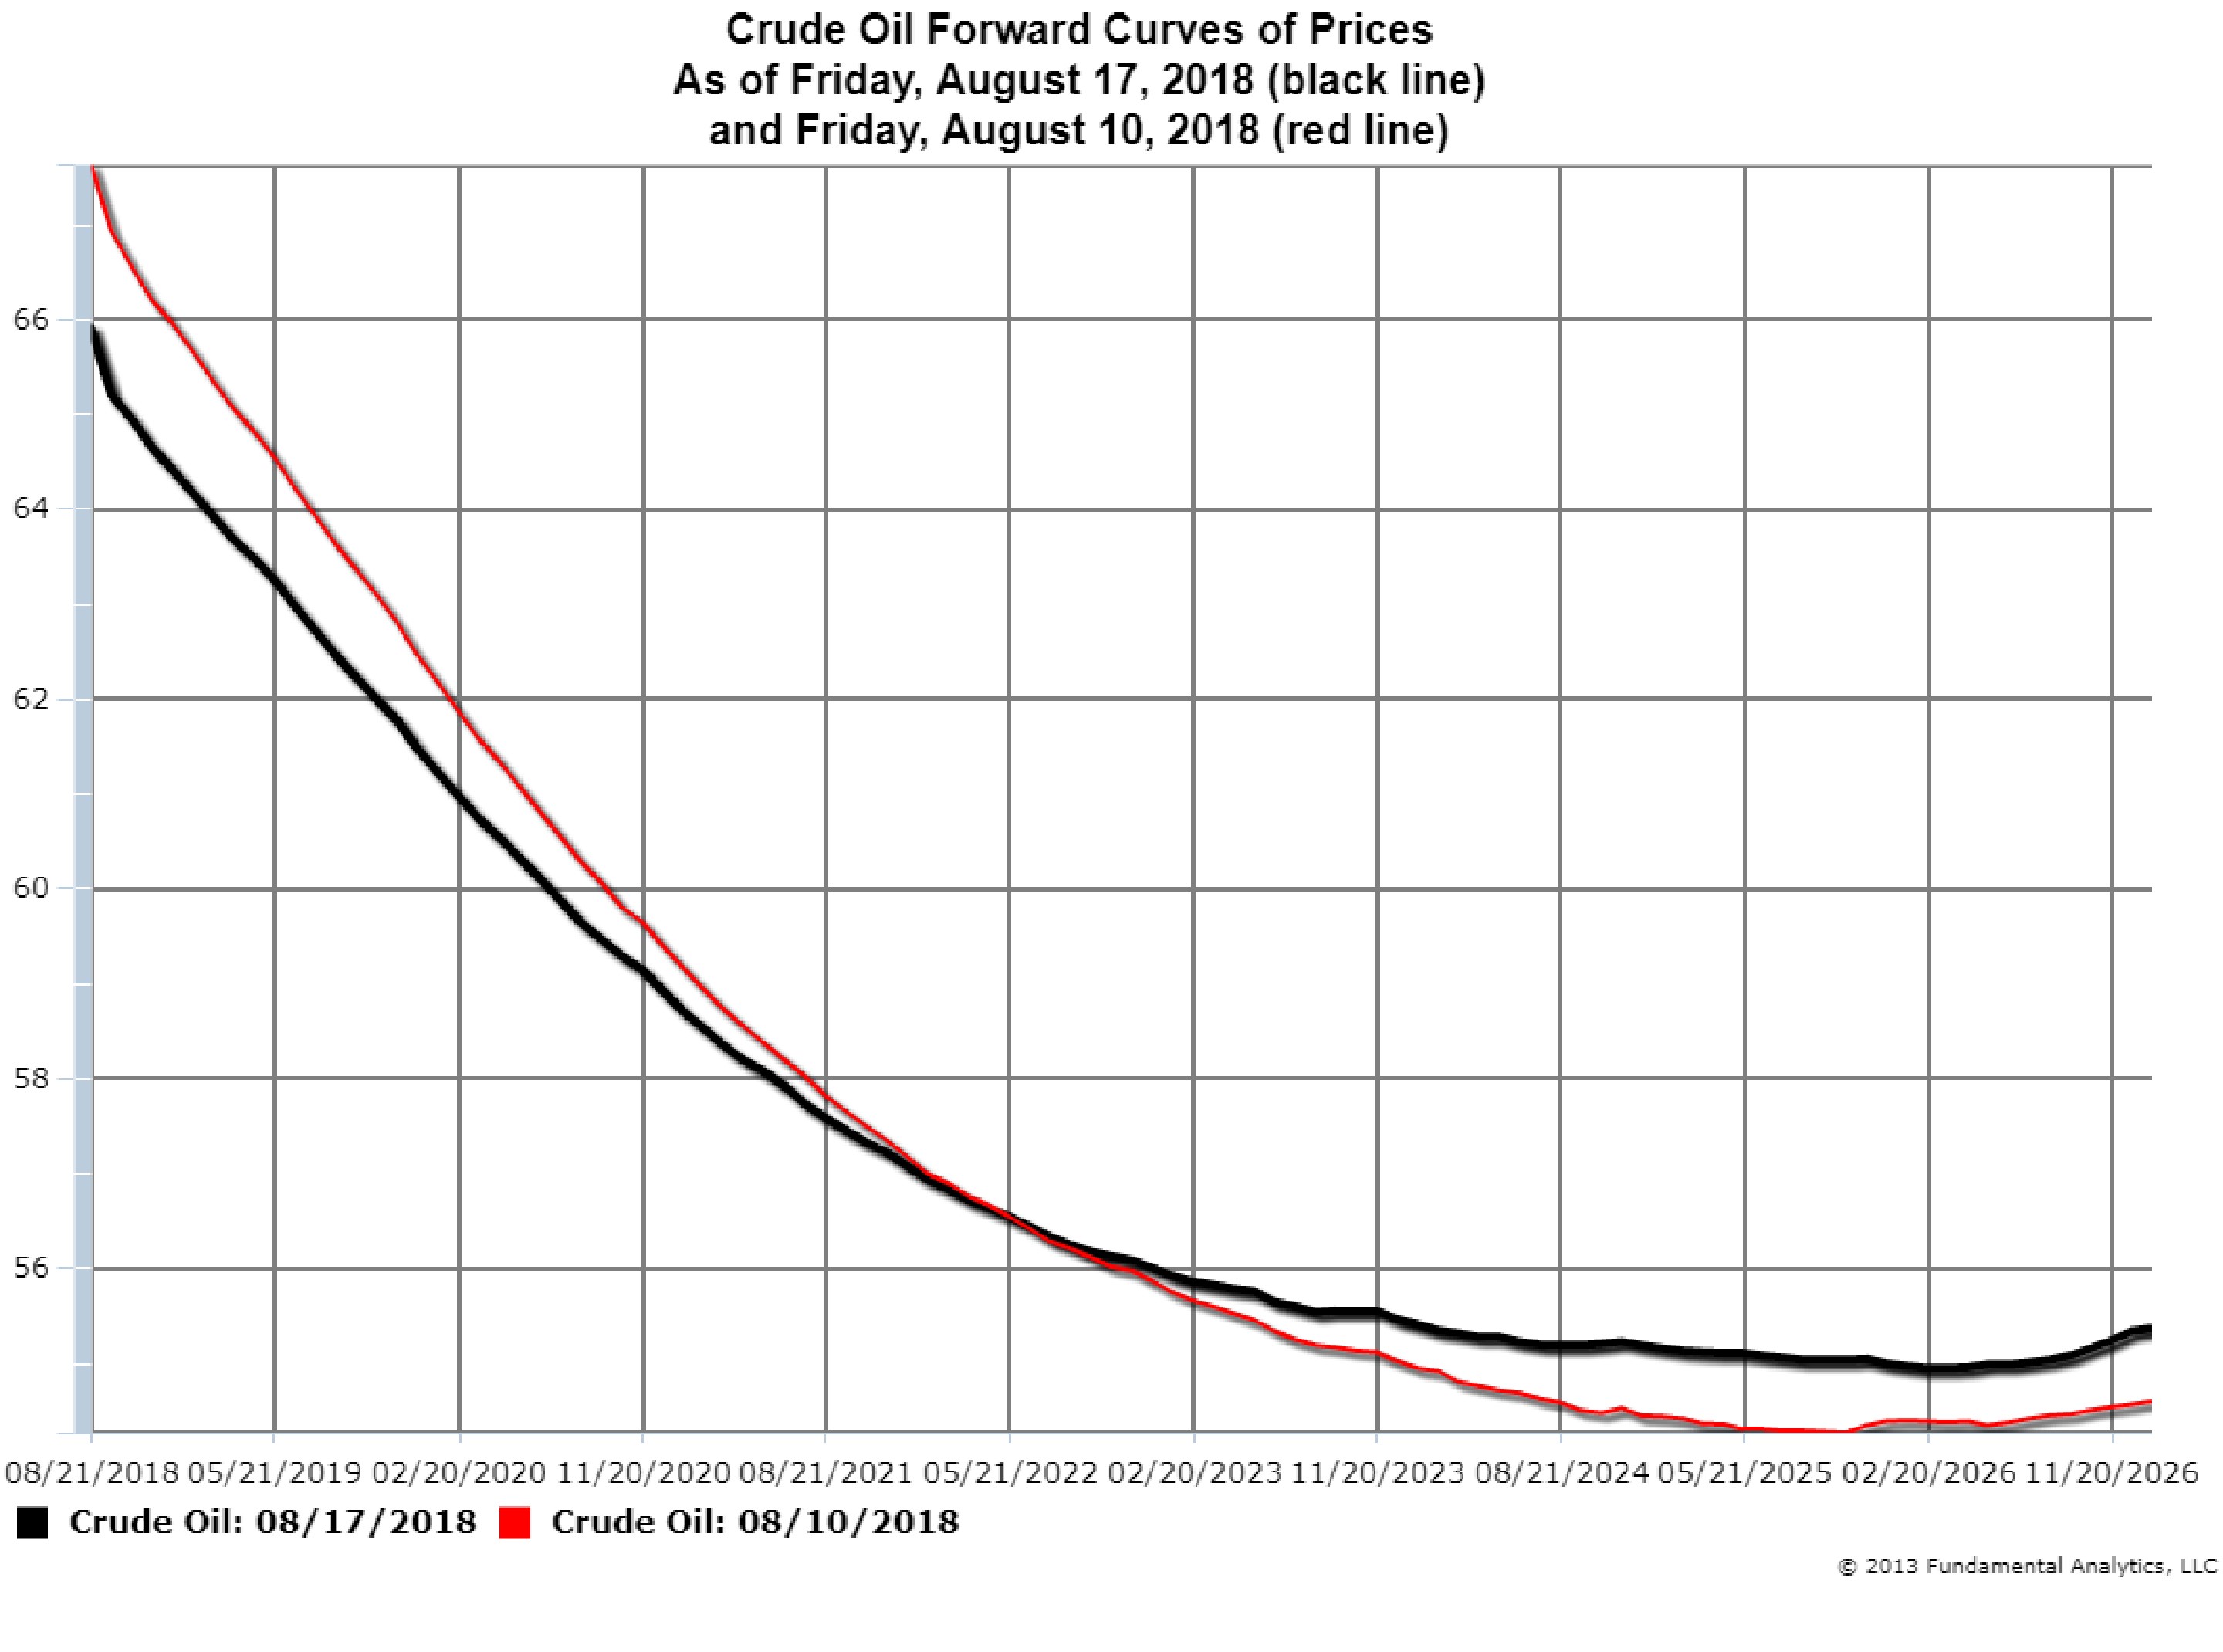
Crude oil prices are still backwardated. The deferred months are priced lower than the nearby months. The two curves in the chart below show the change in prices from Friday, August 10 (red line) to Friday, August 17 (black line). A greater vertical spread between the red line and the black line indicates prices dropped more during that week. In the back of the curve, beginning near February 20, 2023 (the March 2023 contract), prices actually increased from August 10 to August 17.
Chart 1
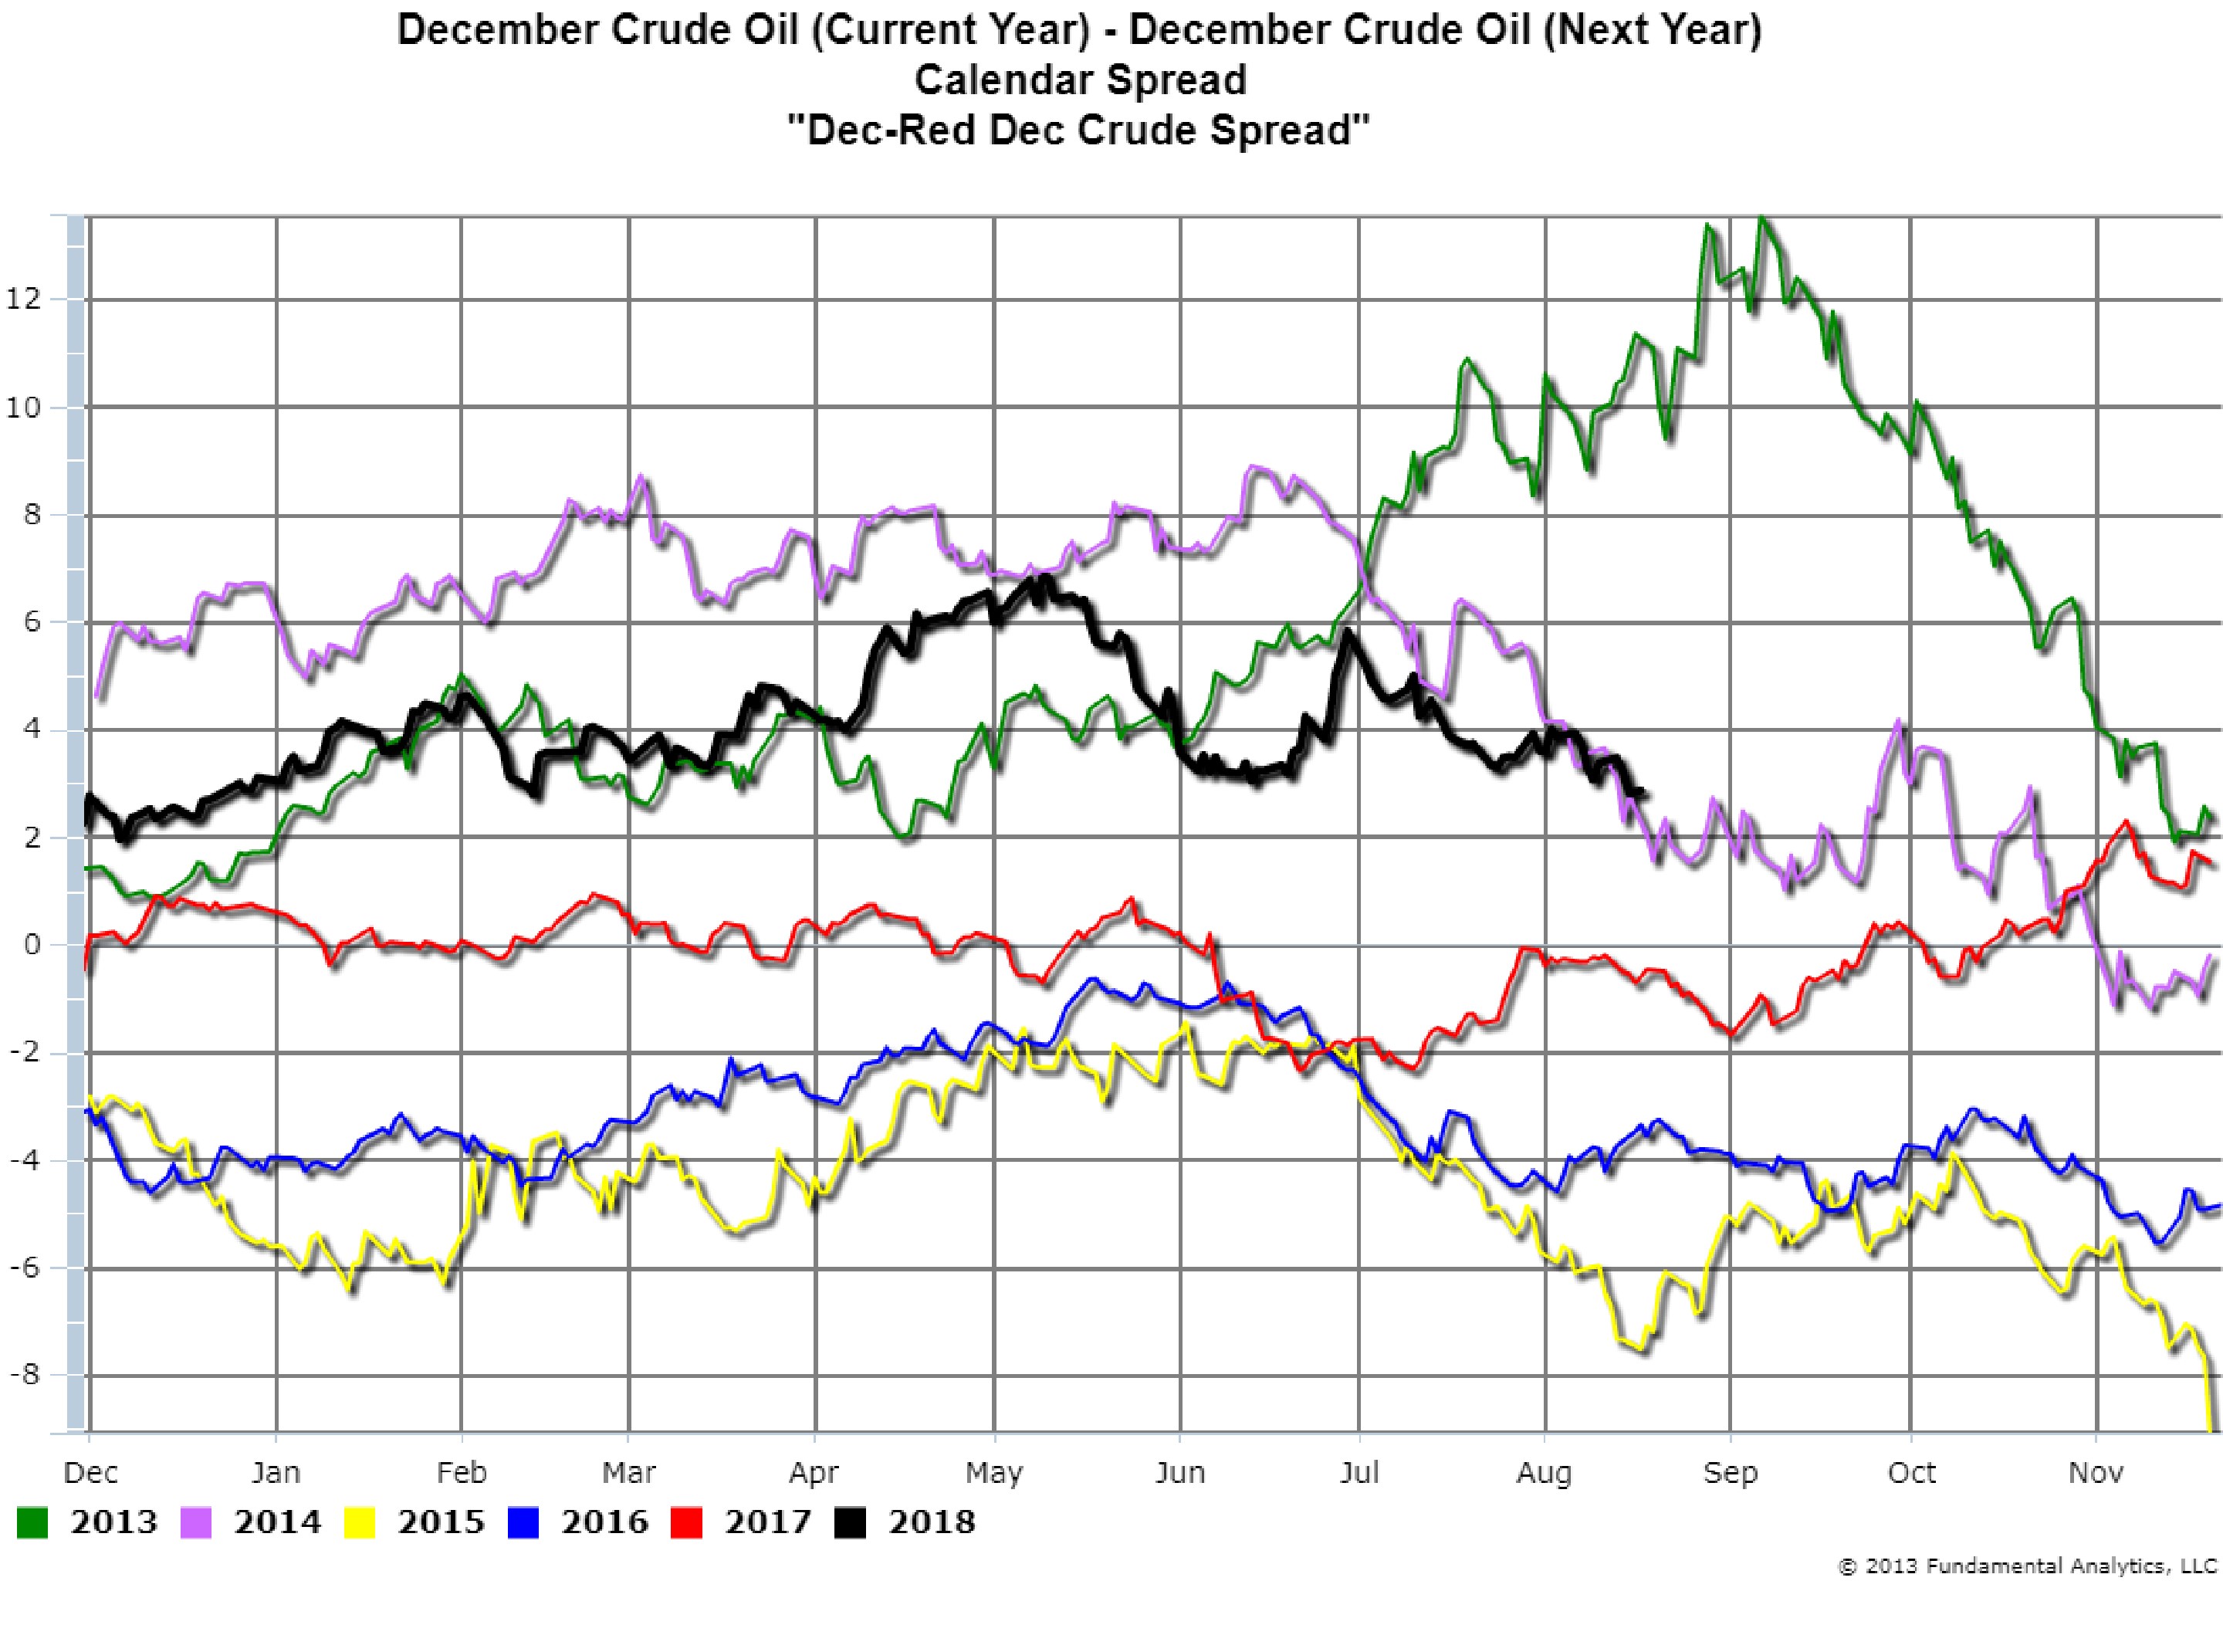
One measure of the steepness of the current Crude Oil Forward Curve is the calendar spread between the December 2018 Crude Oil contract and the December 2019 Crude Oil contract (Chart 2, black line). This spread is often referred to as the “Dec-Red Dec Crude Spread,” because the next year’s December contract is called a red year contract. Starting with the December 2013 – December 2014 Crude spread (green line) the last 5 years are shown in Chart 2. A positive spread value indicates a backwardated forward curve, and a negative spread value (Chart 2, yellow and blue lines) indicates a contango market. Backwardated markets are usually bullish markets, whereas contango markets are usually bearish markets. As of Friday, August 17, 2018, the Dec-Red Dec spread was about $3.00. If the spread value decreases that would indicate that the market is less backwardated and less bullish. If the spread value increases that would indicate that the market is more backwardated and more bullish.
The Crude Oil market has been range bound recently, but as long as the Dec-Red Dec spread remains positive and the Forward Price Curve remains backwardated we view the market from a bullish perspective.
Chart 2
Grains
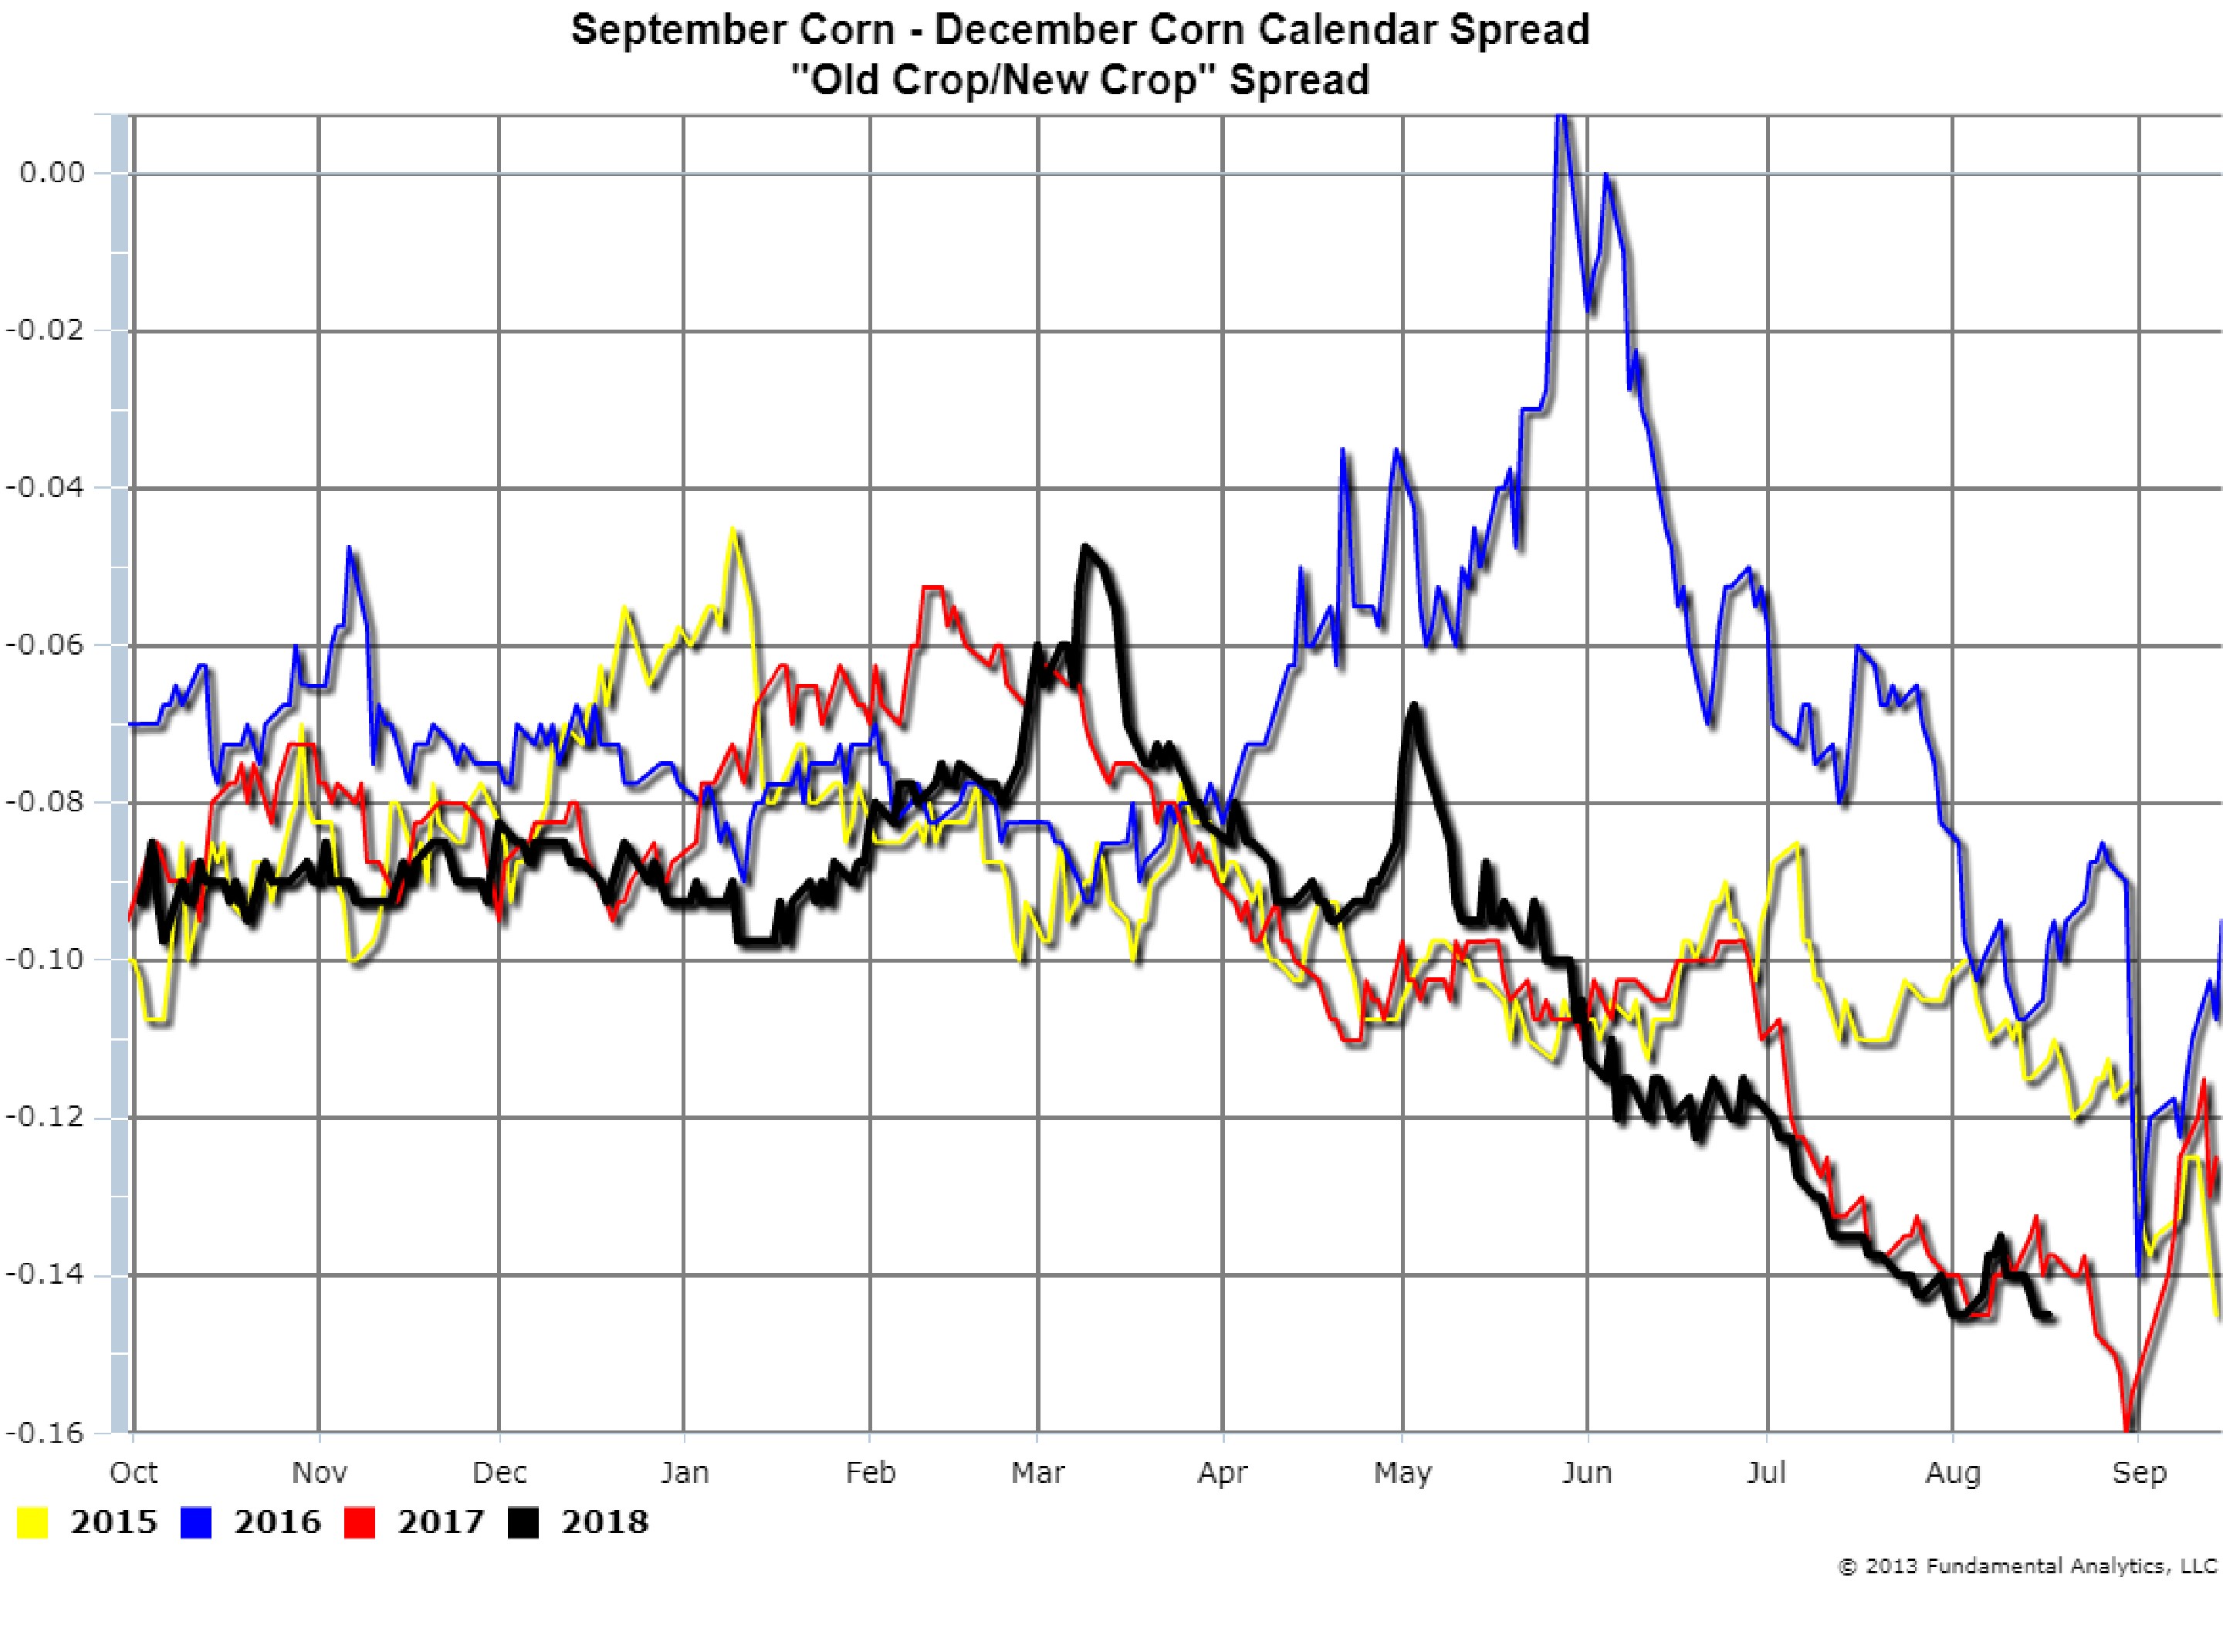
During the corn planting and growing months in the spring and summer, the supply of corn available to corn consumers is the corn that was harvested during the previous harvest season – the old crop. The corn futures contracts associated with the old crop are the contract months of March, May, July, and September. The December futures contract is the new crop contract. The September Corn – December Corn calendar spread is an “Old Crop/New Crop” spread (Chart 3). Because corn crop yields this year are large, crop shortages are not expected and so the new crop is preferred to old crop. Thus, the December Corn futures price is greater than September Corn futures, resulting in a negative spread value. Given the current negative spread we suggest consideration of taking a bearish view of other corn calendar spreads, e.g. Dec-Mar or Mar-May calendar spreads.
Chart 3
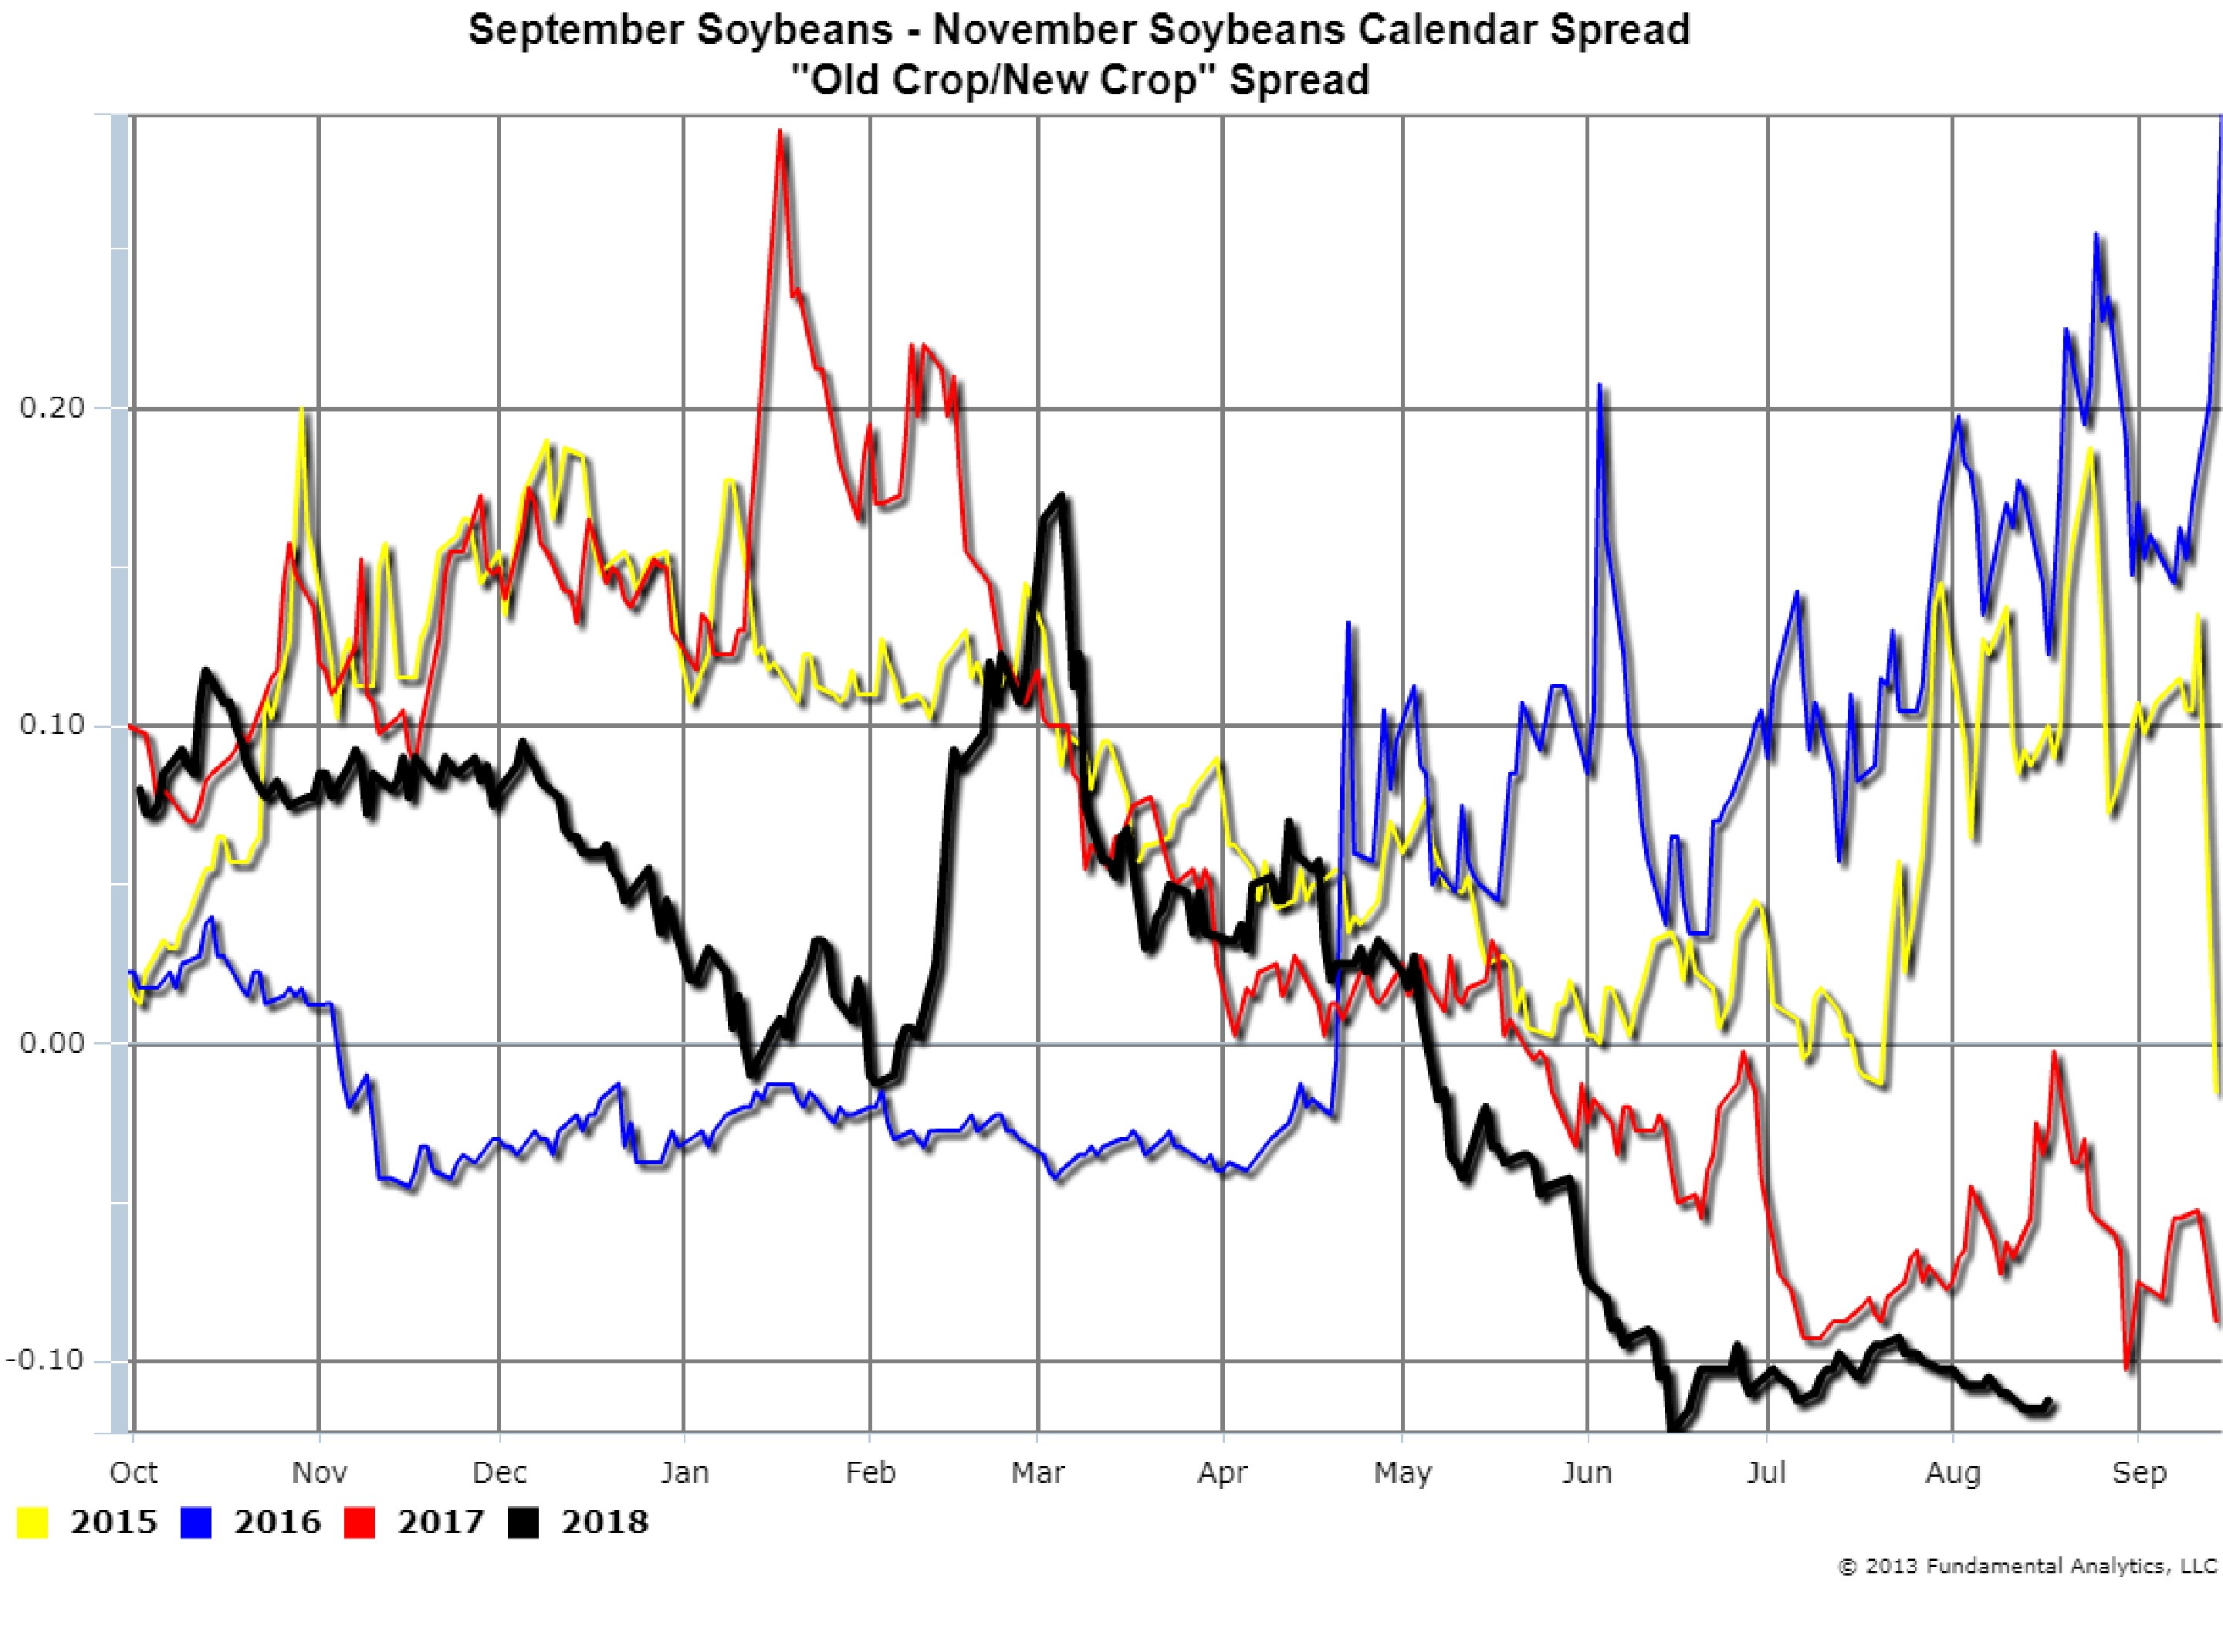
The same crop production trend described for corn also applies to soybeans. However, with soybeans, it is likely that tariffs have increase this negative spread. The September-November soybeans spread (Chart 4) has been setting record lows since early May (black line). In addition to the good crop, the tariff pressures are currently penalizing US soybeans. Eventually buyers will need US soybeans and will bid up to get them. Thus, new crop is preferred to old crop not only because of the abundance of supply, but also because of the expectation that, regardless of the tariff, in the future, there will be demand for U.S. soybeans. New crop is preferred to old crop for several reasons, leading to a record-setting low spread. As with corn, we suggest consideration of taking a bearish view of other calendar spreads, e.g. November – March, or March – May calendar spreads.
Chart 4
Subscribe to our email list for more articles, and follow us on Twitter @fundanalytics or on LinkedIn.