Commodity Market Update September 5, 2018
Energy
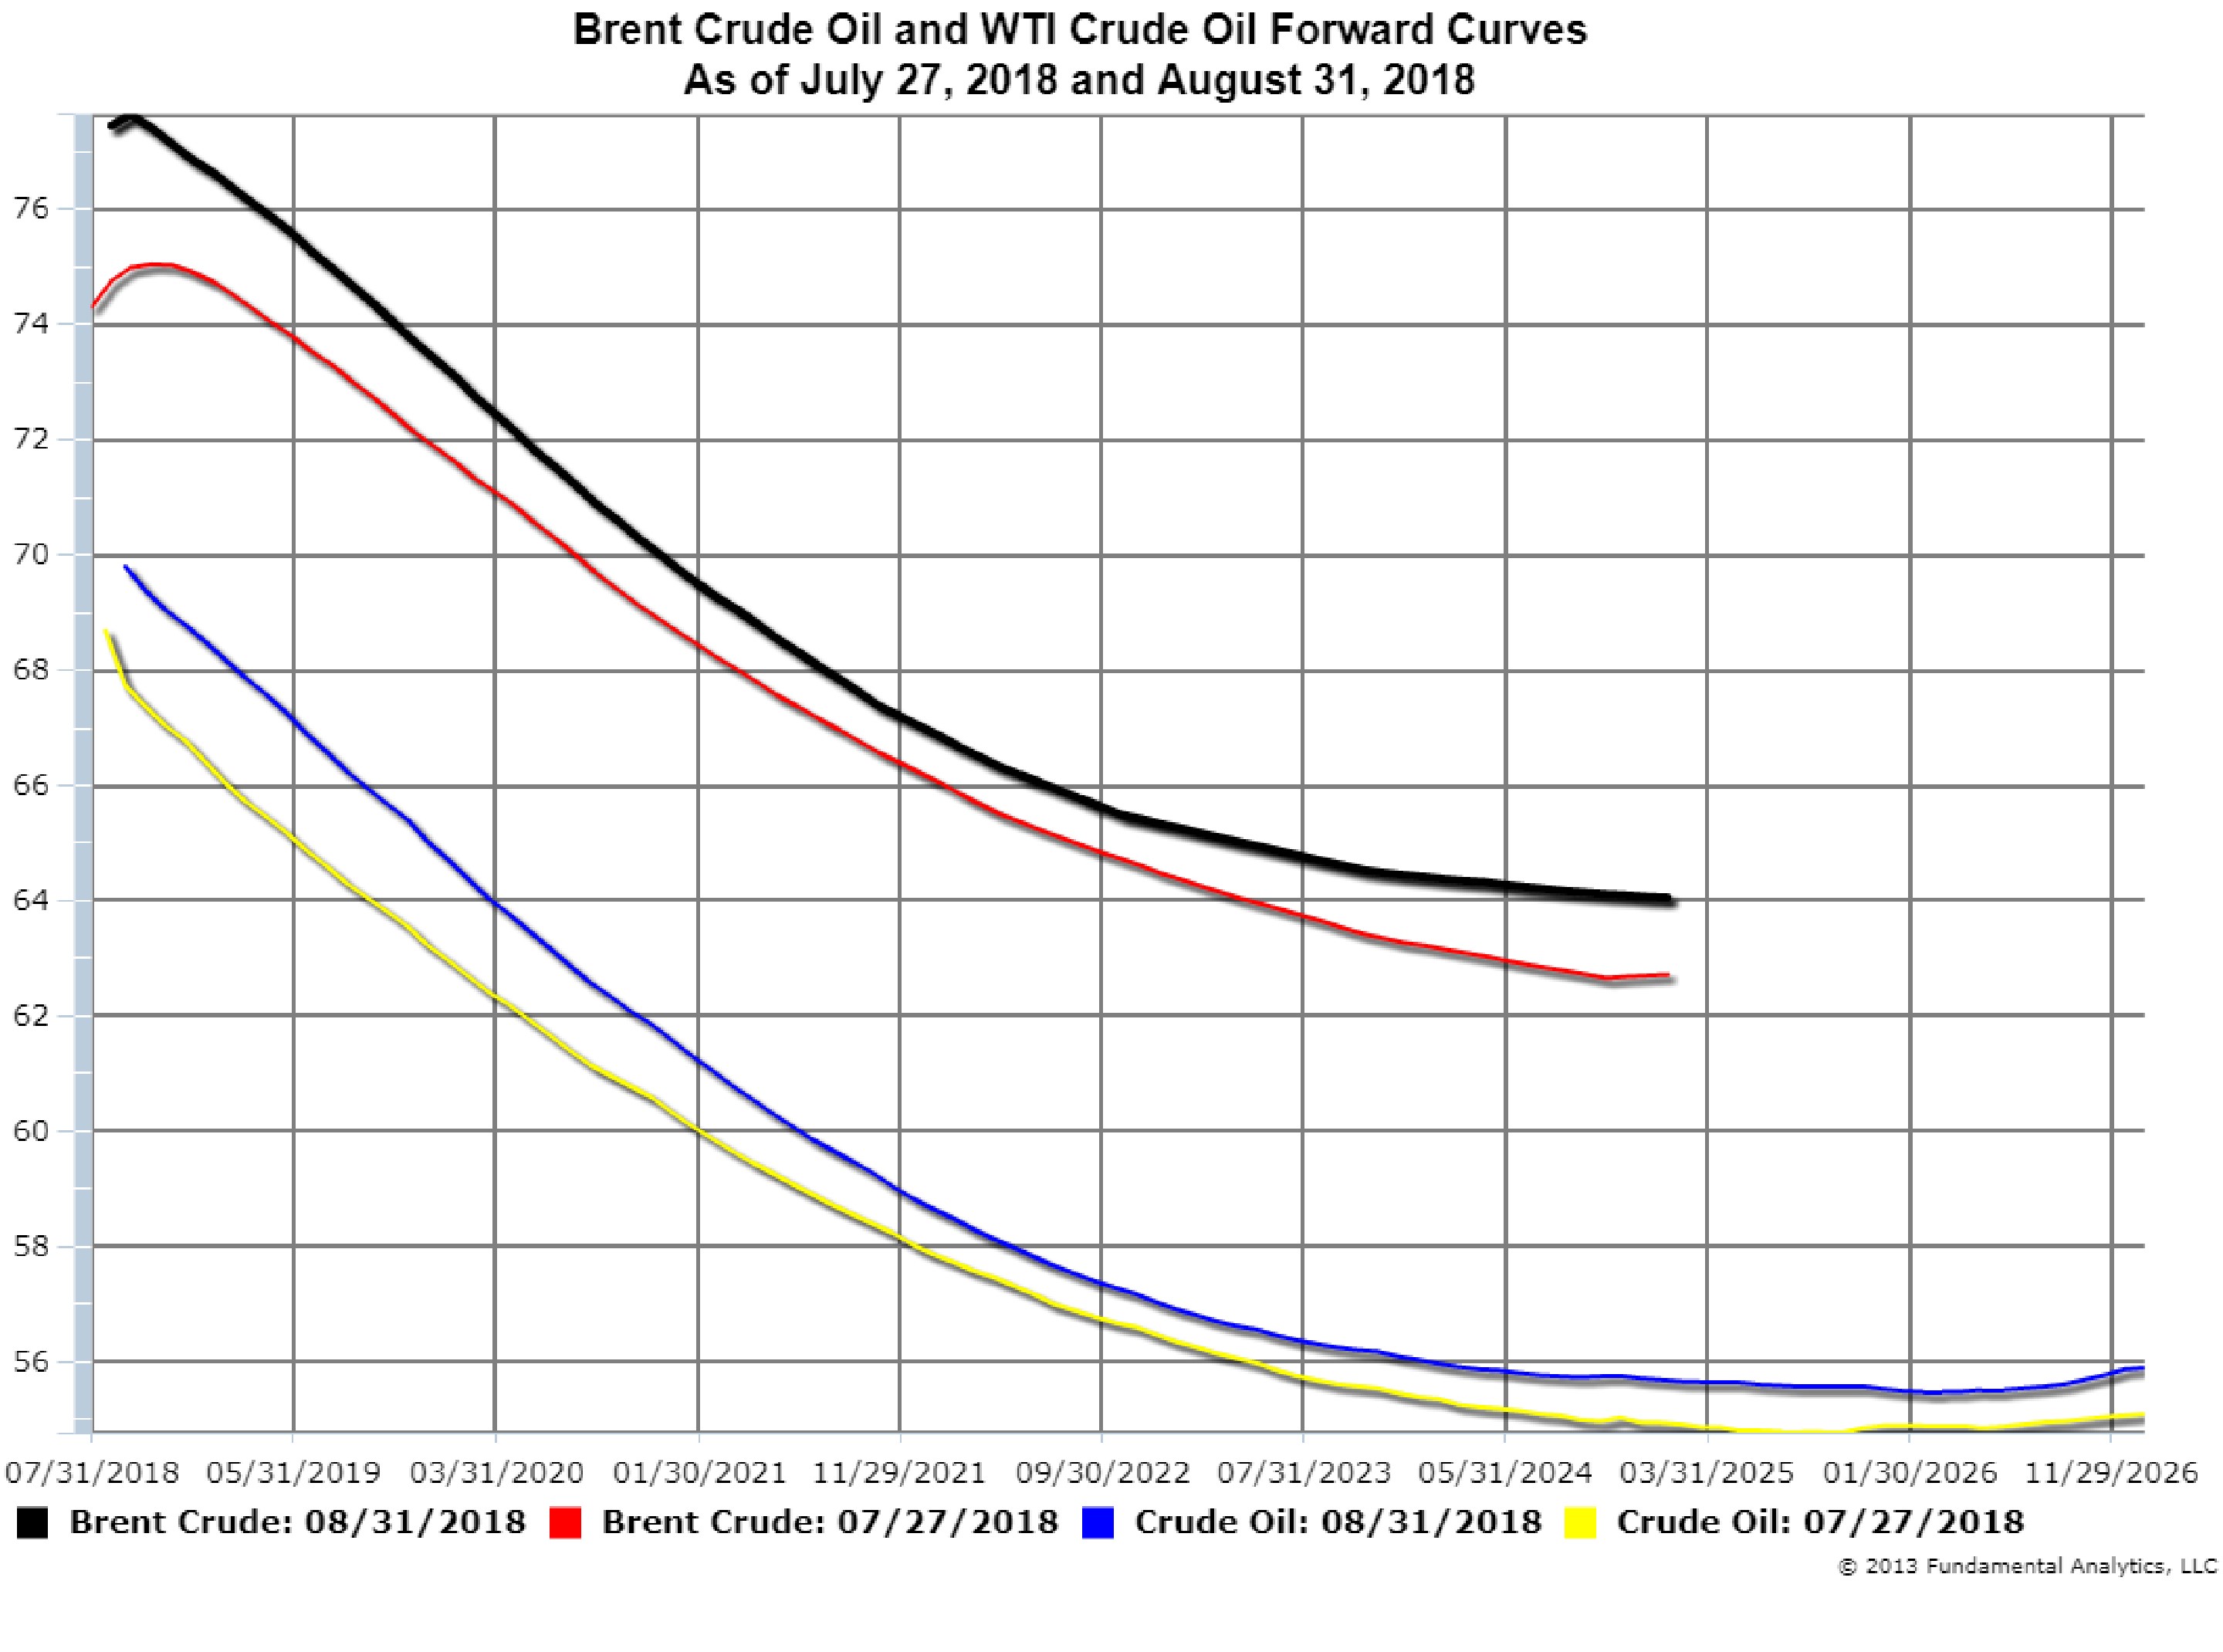
The Brent crude oil forward curve was in contango recently due to an oversupply of crude oil in the Atlantic Basin. The contango has reduced and the forward curve is moving to backwardation as Iran’s oil exports are reducing and the oversupply is ending. The US sanctions on Iran, scheduled to begin in early November, could reduce supply by as much as 1 million barrels per day of Iranian crude from the market. Chart 1 plots the Brent forward curves on July 27, 2018 and August 31, 2018. As of July 27 (red line), the first-to-second month spread was 47 cents. By August 31 (black line), the front of the Brent curve had shifted up by $3 and the spread had decreased to 19 cents. The WTI forward curve (yellow and blue lines) had shifted up by $2.
Chart 1
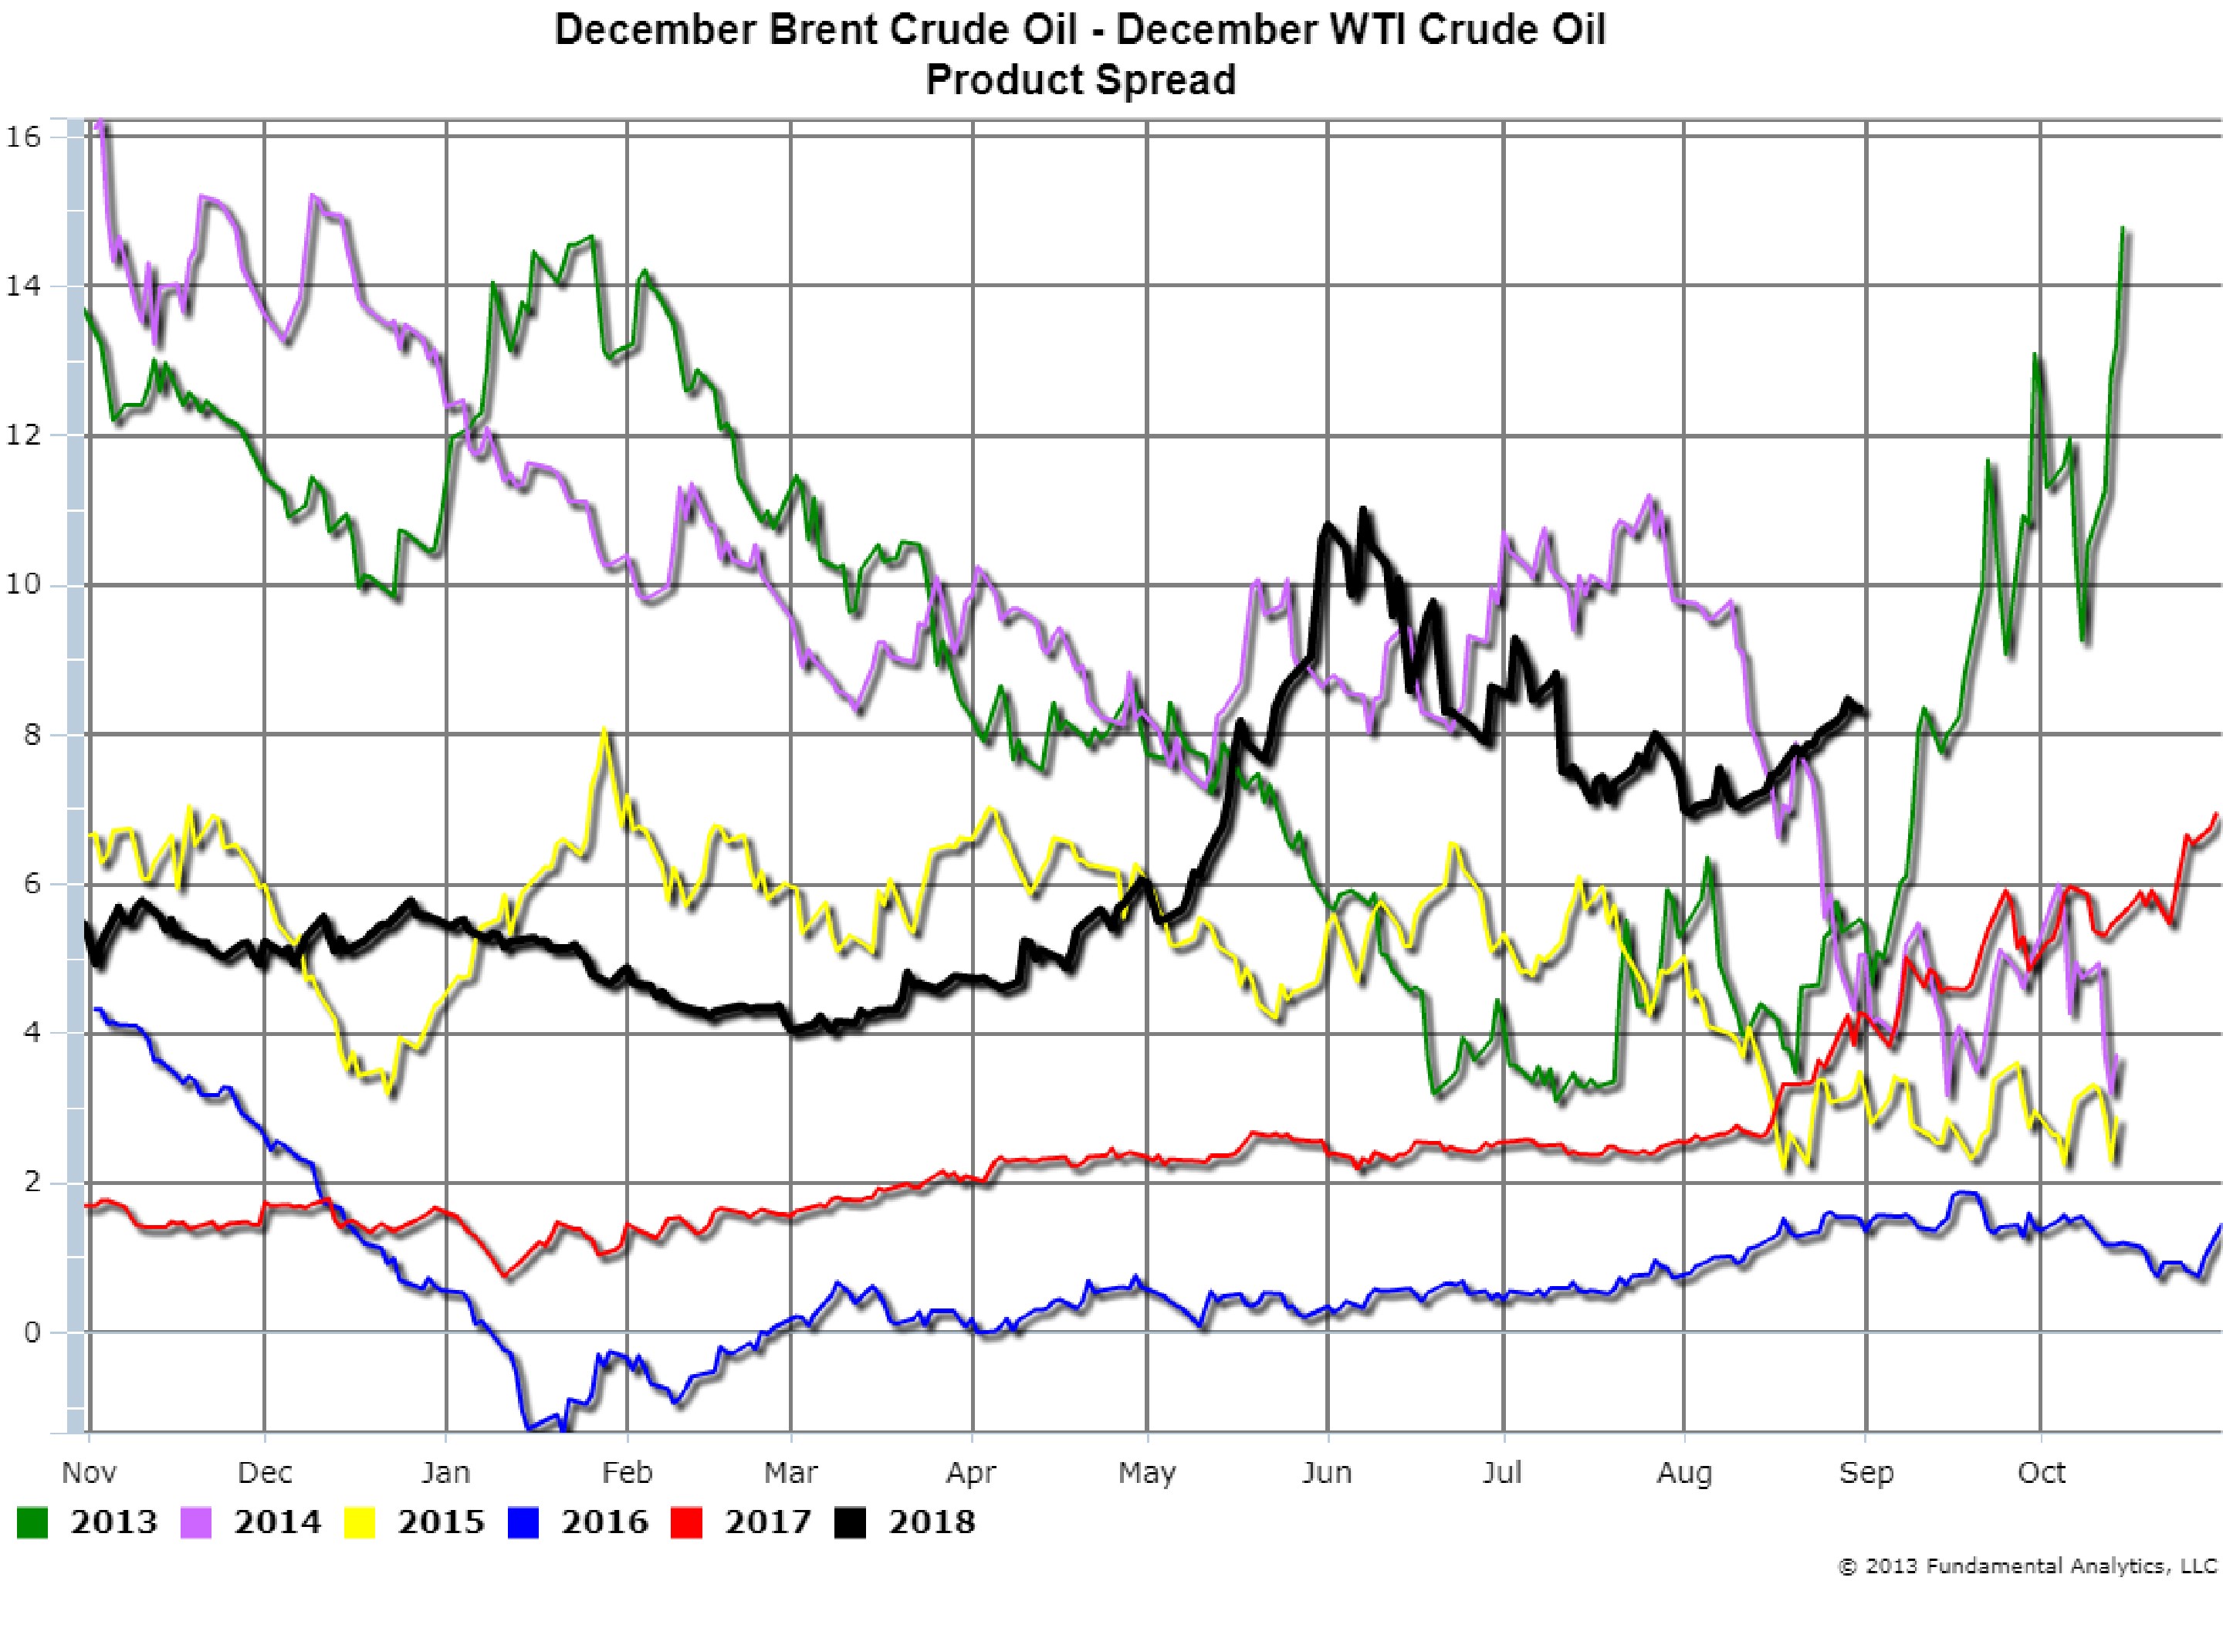
As a result of the forward curve’s rise the Brent-WTI spreads have strengthened. For example, Chart 2 plots the December Brent-December WTI Crude Oil spread. The 2018 contracts spread (black line) has increased by $1.40 since the beginning of August. We suggest consideration of a long position in a Brent-WTI spread as the spread has the potential for a $2 increase during the month of September.
Chart 2
Grains
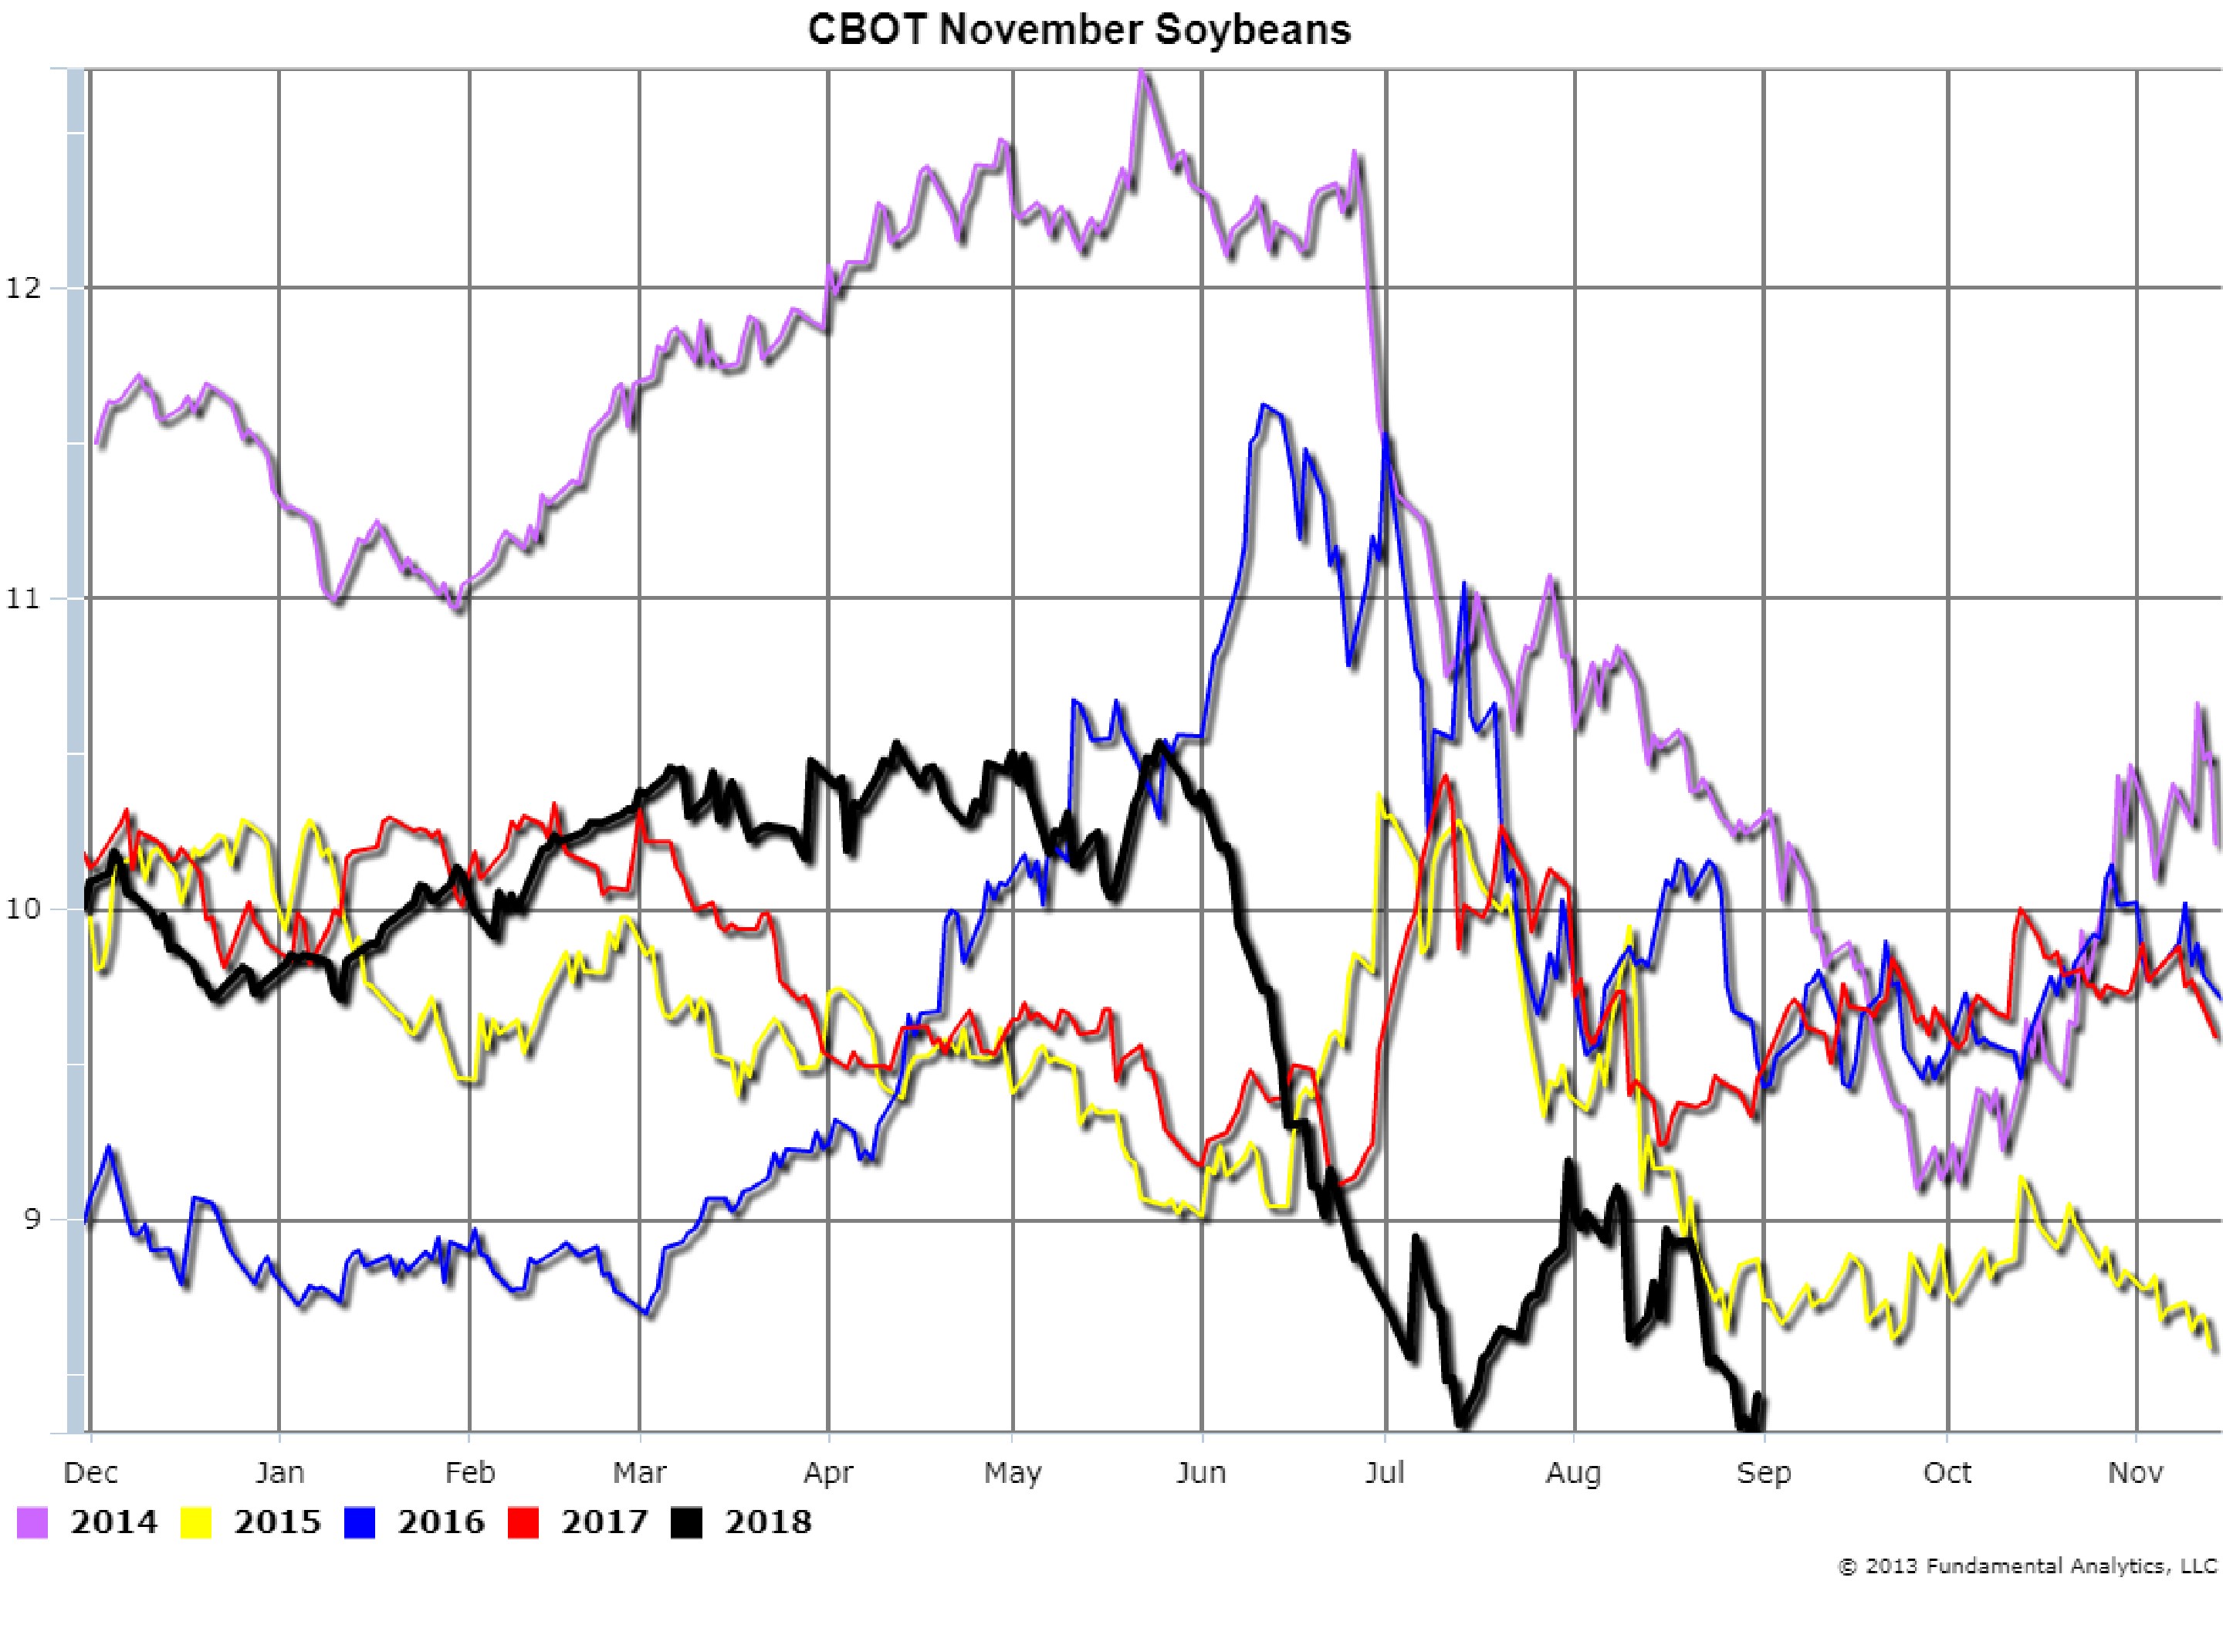
Grains prices decreased significantly during the month of August due to good crop conditions and expected large yields as well as the impact of the China tariff. December corn was down 22 cents (Chart 3, black line) and November soybeans were down 75 cents (Chart 4, black line) for the month. It appears to that the fundamental conditions will not change in the near term, so we recommend consideration of short positions in the outrights or in the calendar spreads; for examples, the Dec-Mar Corn spread, or the Nov-Jan Soybeans spread.
Chart 3
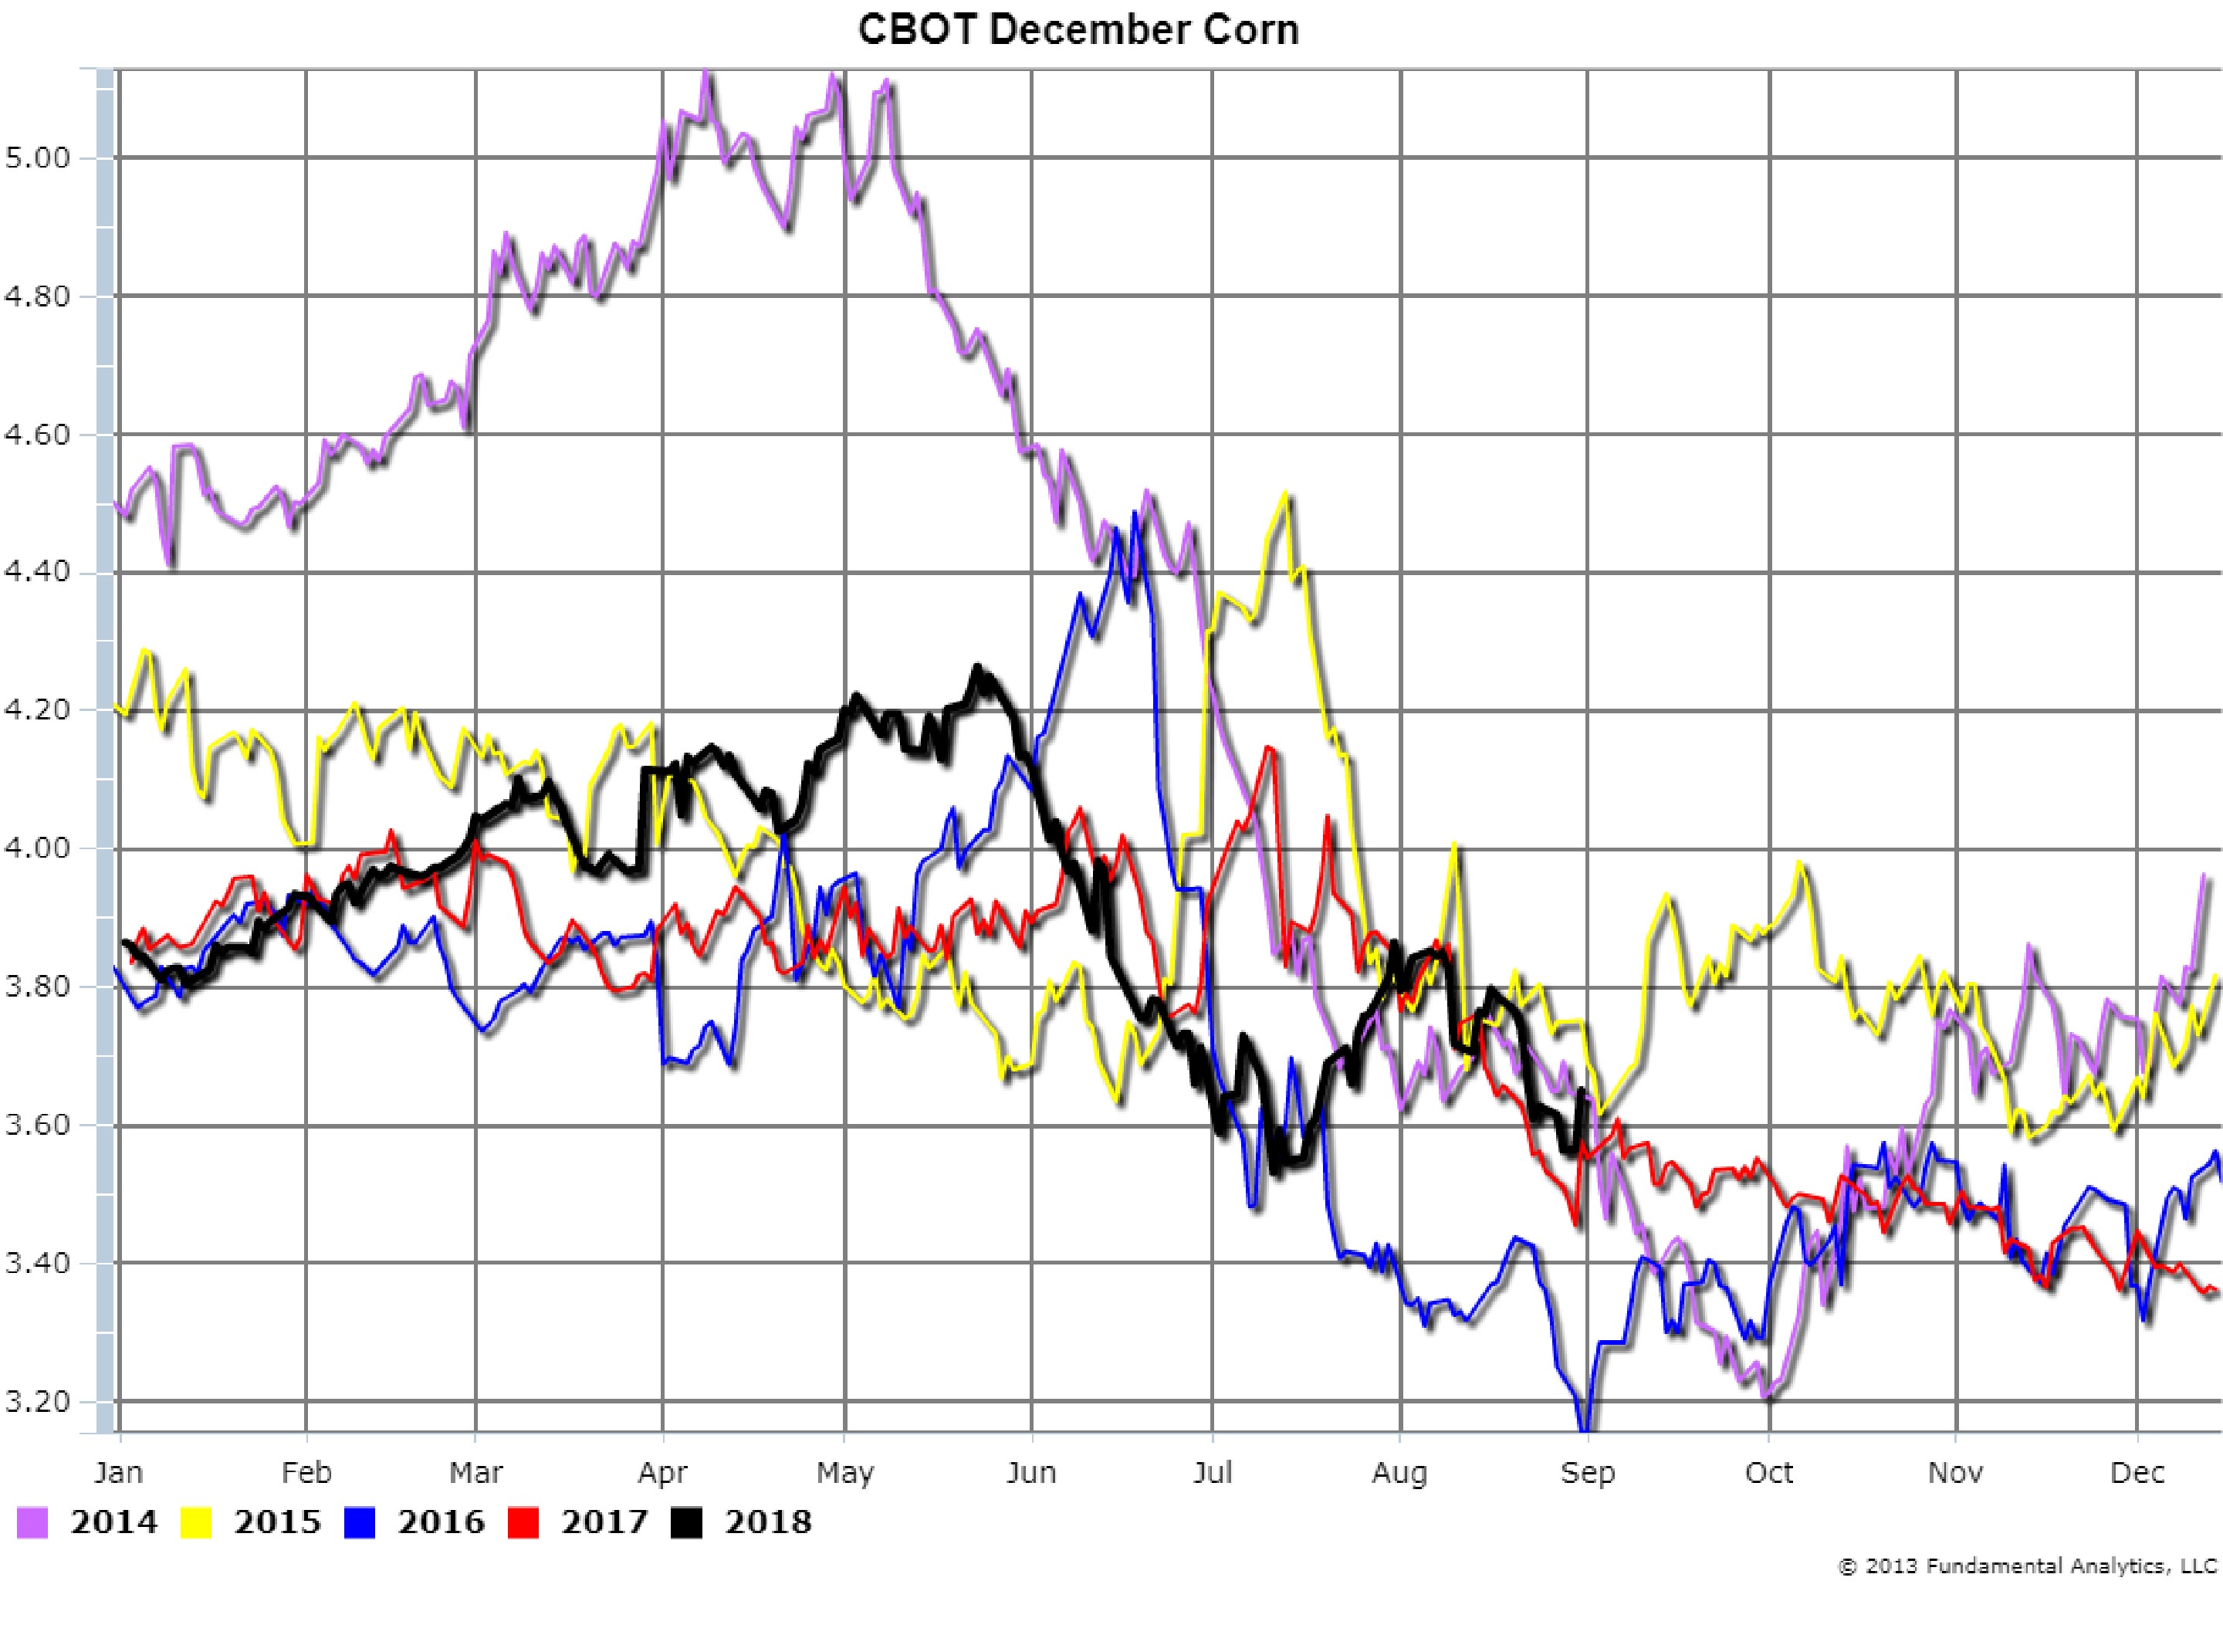
Chart 4
For more information contact joel.fingerman@fundamentalanalytics.com