Fundamental Analytics Monthly Newsletter: January 2019
Fundamentals
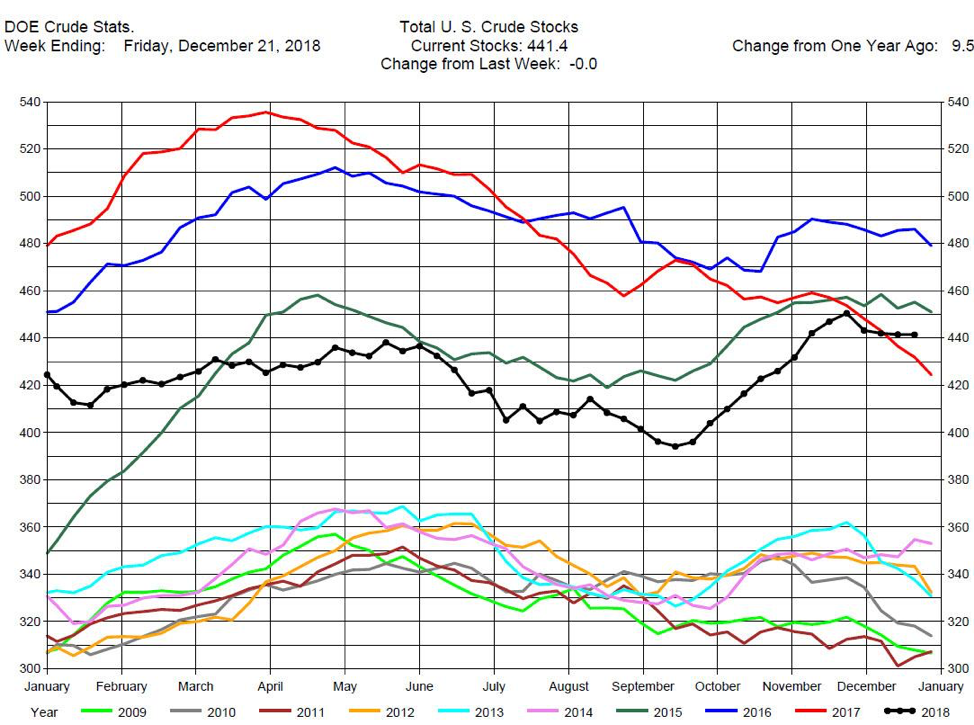
United States Crude Stocks
United States Crude Oil stocks have been on a growth trajectory since mid-September, but have changed minimally in December (Chart 1, black line). A reduction in US production is unlikely unless prices remain low for an extended period of time. OPEC and Russia will be cutting production in early 2019. Given current circumstances, prices for Brent may be stabilizing around $56 and around $48 for WTI in the next few weeks.
Chart 1
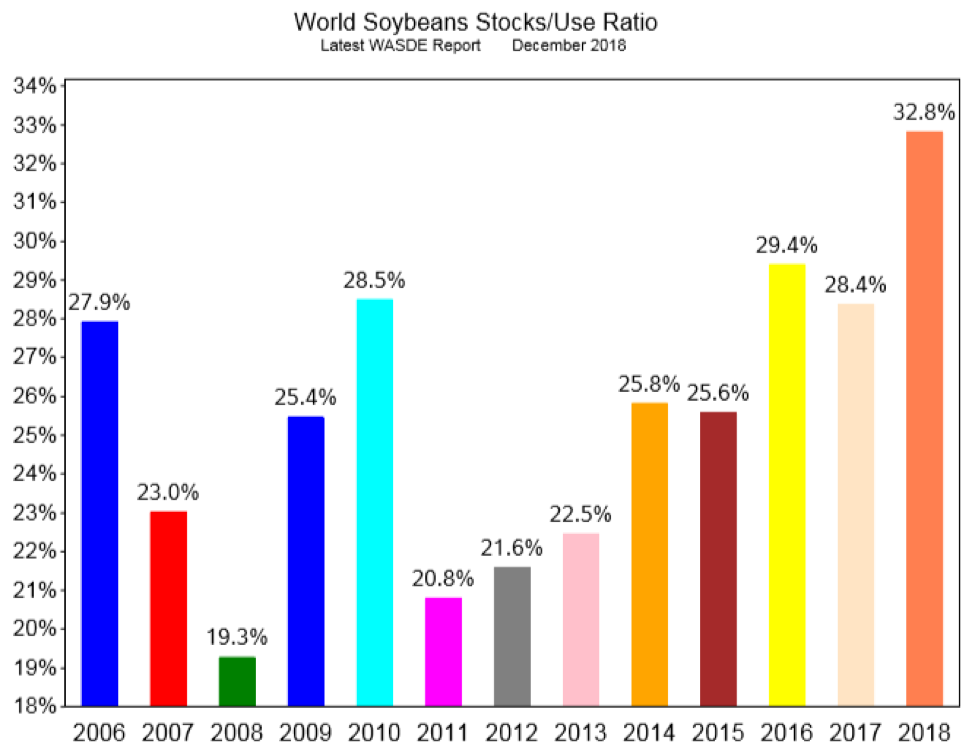
Corn and Soybeans Stocks to Usage Ratio
The world stocks-to-use ratio for corn and soybeans are at historically high levels. Growth in supply is outpacing growth in demand as can be seen in Charts 2 and 3 below. The abundant supplies have contributed to the low prices, and given the current fundamentals we would expect prices to stabilize around $3.70/bu for corn and $8.80/bu for soybeans over the course of the next few weeks.
Chart 2
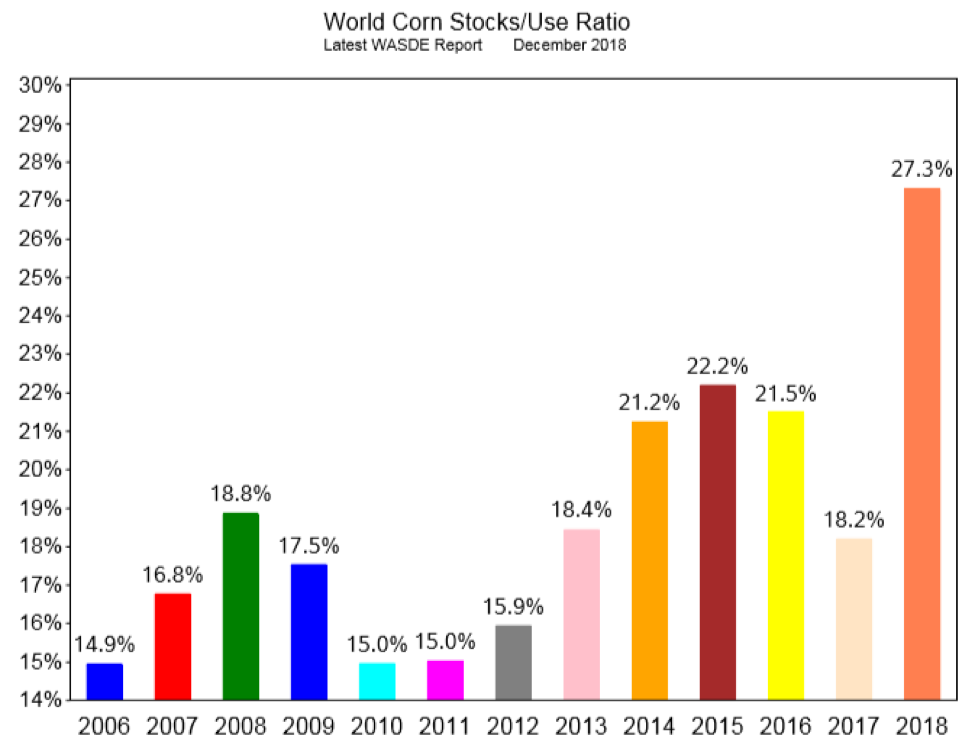
Chart 3
Net Position of Funds as of DEC 18th
The net position of funds is the difference between the non-commercial long positions and the non-commercial short positions in a given market. If there are more long positions than short ones, the net position of funds is positive. A positive net position of funds indicates that speculators anticipate rising prices, whereas a negative net position of funds points towards weakening prices. The net position of funds both leads and lags pricing trends, and often extends their effects. Table 1 below shows whether the net position of funds is positive or negative for a select group of commodities as of December 18th.
Table 1
| Commodity | Net Position of Funds |
| Crude Oil (light sweet NYMEX) | POSITIVE |
| Natural Gas (NYMEX) | POSITIVE |
| Gold (CMX) | POSITIVE |
| Corn (CBOT) | POSITIVE |
| Soybeans (CBOT) | POSITIVE |
Platform Potential
The commodity market research platform offered by Fundamental Analytics is intuitive and easy to use. The highly customizable year-on-year default visualizations offer a superb tool for creating and visualizing spreads against their historic levels. Research by Joel Fingerman in late November exemplifies the value of the spread functionalities of the Fundamental Analytics platform.
Note: The comments below reflect updates and commentaries that we send regularly to our distribution lists. Because some time has now passed since its original release, the content below should not be regarded as up-to-date market commentary. If you wish to receive this type of analysis in a timely fashion, please let us know. In addition, you can conduct your own research by subscribing to our research platform. For more information give us a call at (859) 687-2748 or visit www.fundamentalanalytics.com.
Commentary originally from the third week in November:
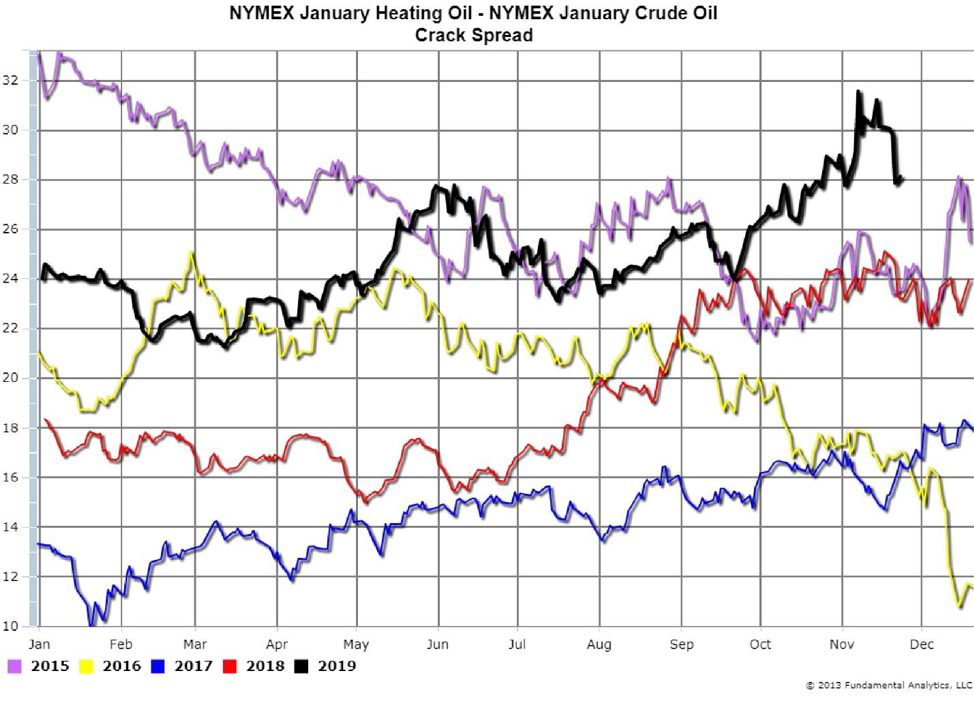
During the recent dramatic decline in Crude Oil prices since the beginning of October the prices of the refined products of Heating Oil and Gasoline have also decreased. However, Heating Oil prices did not decline as much the Crude Oil prices, so the price spread difference between Heating Oil and Crude Oil, the “Crack Spread,” increased in value (Chart 4, black line). Since the beginning of October, the refiners’ profit margin in Heating Oil has increased.
Chart 4
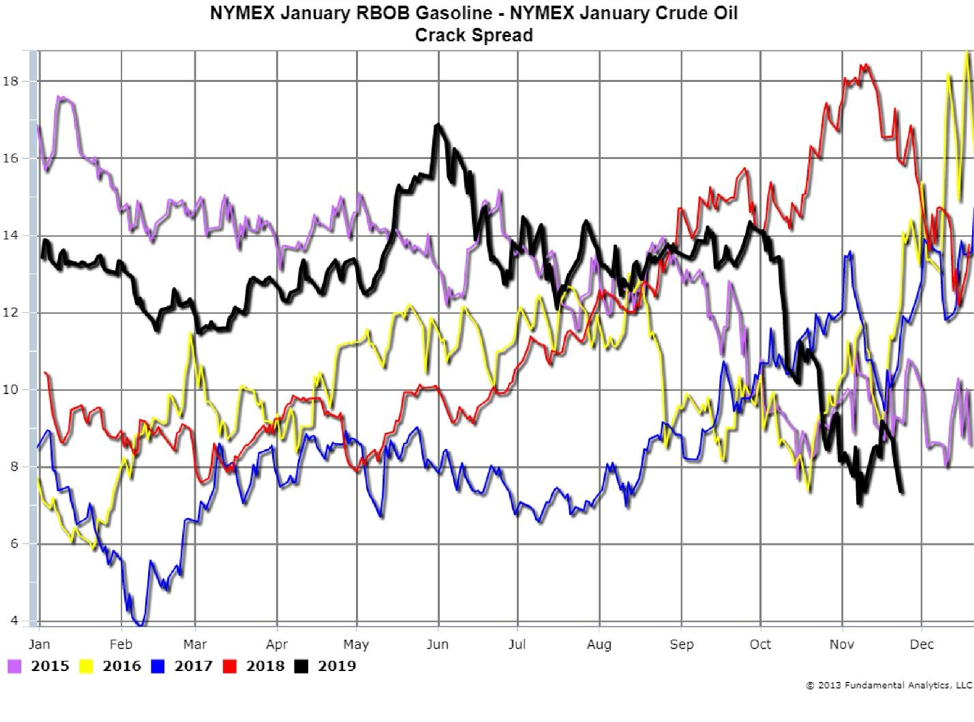
Conversely, during the same time period Gasoline prices declined greater than Crude Oil prices, so the Gasoline Crack Spread decreased in value (Chart 5, black line below).
Chart 5
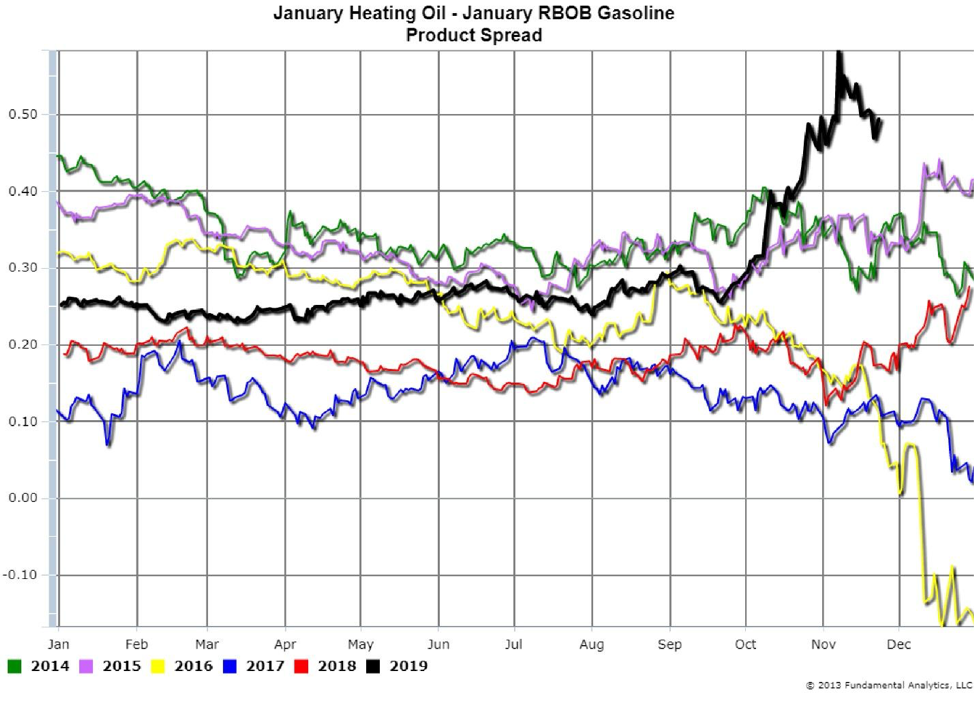
Given the refined products different rates of decline, the product spread of January Heating Oil –January Gasoline increased from 30 cents at the beginning of October to as much as 60 cents before settling back (Chart 6, black line below ). With Heating Oil (Diesel Fuel) in strong demand and Gasoline having lower demand during the Winter Season, it is not surprising that Heating Oil prices outperform Gasoline prices, even in a down market.
Chart 6
As can be easily understood such analysis can increase trading profit margins and we would be happy to work with you if you are interested in trying our platform for free.
Weekly Commentary Summary
Fundamental Analytics offers timely weekly commentaries tied to reporting from the DOE, as well as weekly reports on crude oil and natural gas. We also offer a weekly commodity market update highlighting developments in agricultural and energy markets. If you are interested in receiving any or all of these updates, please let us know. Below are some summaries of our December Commodity Market Updates.
Note: The comments below reflect updates and commentaries that we send regularly to our distribution lists. Because some time has now passed since its original release, the content below should not be regarded as up-to-date market commentary. If you wish to receive this type of analysis in a timely fashion, please let us know. In addition, you can conduct your own research by subscribing to our research platform. For more information please give us a call at (859) 687-2748 or visit www.fundamentalanalytics.com.
December 4
Energy
Forward curves of Brent Crude Oil and WTI Crude Oil reflected the collapse in prices which occurred in October and November. These markets being in contango puts downward pressure on prices. However, the US-China agreement on the 90-day tariffs moratorium caused most commodity prices to jump.
OPEC, along with Russia, were expected to announce production cuts to reduce the oversupply in the global crude oil market. Qatar has said it will leave OPEC in January; however, Qatar’s crude oil production is only about 600,000 bpd. Analysts estimate that a production cut of more than 1 million barrels per day is needed to stabilize or increase prices.
Corn
Export demand is strong, and that is reflected in the rising prices. The Weekly Export Sales report for the week ending on November 22 was greater than estimated with impressive Accumulated Exports for the New Market Year.
Soybeans
In contrast to corn, the FAS Weekly Export Sales report shows Soybeans Weekly Export Sales at historic lows as Chinese import tariffs significantly reduced US soybeans exports. The Accumulated Exports were the lowest in the last 6 years.
Normally this would indicate lower prices, but President Trump and Chinese president Xi Jinping at the G20 meeting agreed to a 90-day moratorium on tariffs. According to the White House, the Chinese have agreed to buy an unspecified but “very substantial” quantity of agricultural products. Prices in both corn and soybeans gapped up at the opening of trading Sunday night.
Due to the large amounts of soybeans in storage, soybean calendar spreads are at the lowest values in several years.
December 11
Energy
The latest CFTC Commitment of Traders Report as of Tuesday, December 4, 2018 shows the Non-Commercials Net Long Positions decreased during the week by 15,940 contracts to 382,836 contracts. 11,569 Long positions were closed and 4,371 Short positions were established.
OPEC with Russia have agreed to a production cut of 1.2 million barrels per day. The expectation is that this reduction in output will balance global crude oil supply against demand.
Prices have remained in the low $50 level as traders wait for confirmation of compliance with the output cut. We expect this geopolitical uncertainty to contribute to high price volatility.
Grains
The USDA WASDE December 2018 report was released Tuesday, December 11, 2018. US Corn Ending Stocks will support US corn prices, but the World Ending Stocks continue at record levels. US and World Ending Stocks remain bearish to soybeans prices.
December 18
Energy
Crude oil prices are under pressure after stocks at the storage hub of Cushing, Oklahoma increased by more than 1 million barrels during the week ending December 14, according to the oil research firm Genscape. Cushing is the delivery point for the NYMEX WTI futures contract and prices there impact national crude oil prices.
Prices have remained low as traders are concerned that planned supply cuts by OPEC with Russia will not be enough to re-balance markets. The agreement is to reduce output by 1.2 million barrels per day starting in January for six months. However, US shale oil output is growing, taking market share from the big Middle East oil producers in OPEC.
Grains
Soybean exports continued to be substantially lower than previous years due to the lack of exports to China. The 90-day suspension of Chinese tariffs has allowed Chinese buyers back in US markets, but the initial orders were smaller than expected. Unless exports to China increase substantially, the downward pressure on US prices will continue.
The full content of our weekly commentaries can be accessed on our website at www.fundamentalanalytics.com/articles. Weekly commentaries and updates will be free until April. Effective April 2019, a subscription will be required in order to receive them. Of course, clients of Fundamental Analytics and BlackSummit Financial Group will continue receiving them for free.
What to Watch in the Upcoming Weeks:
Below are a few things to watch in early/mid-January of 2019. These factors are likely to impact energy and agricultural markets.
- Impacts of production cuts from OPEC with Russia in early 2019.
- US Crude Oil Stocks
- US soybean exports to China
- Strengthening relations between Brazil and USA with newly elected Brazilian president, and consequences to China trade war, as they depend on soy supply.
- The trajectory and strength of the USD. Signs of weakness could be strengthening commodities
For more insights and analysis or to find out about our free trial offer go to https://www.fundamentalanalytics.com
Follow us on Twitter @fundanalytics, LinkedIn and Facebook
Please let us know if you want to receive weekly commentary and analysis or a free trial of our platform.
Disclosure
Trading and investment carry a high level of risk, and Fundamental Analytics LLC does not make any recommendations for buying or selling any financial instruments. We offer educational information on ways to use our sophisticated research analysis platform, but it is up to our customers and other readers to make their own trading and investment decisions or to consult with a registered advisor. The opinions expressed here are solely those of the author and do not constitute advice by Fundamental Analytics or its affiliates.