Energy
The Crude Oil price cycle
It is a common view that the oil market is cyclical. Brent’s six-month calendar spread had a low of -7.4 dollars in January 2015 (Chart 1, yellow line) and then reached a major peak of 3.5 dollars in April 2018 (Chart 1, black line) before trending downwards. Front month spot prices reached a similar peak in early October 2018. Hedge funds have liquidated a large share of their bullish positions in recent weeks suggesting lower prices. Oil prices, spreads, the increased supply from producers, and slowing crude oil demand growth all indicate the market has passed the first major cyclical peak after the lows in 2015.
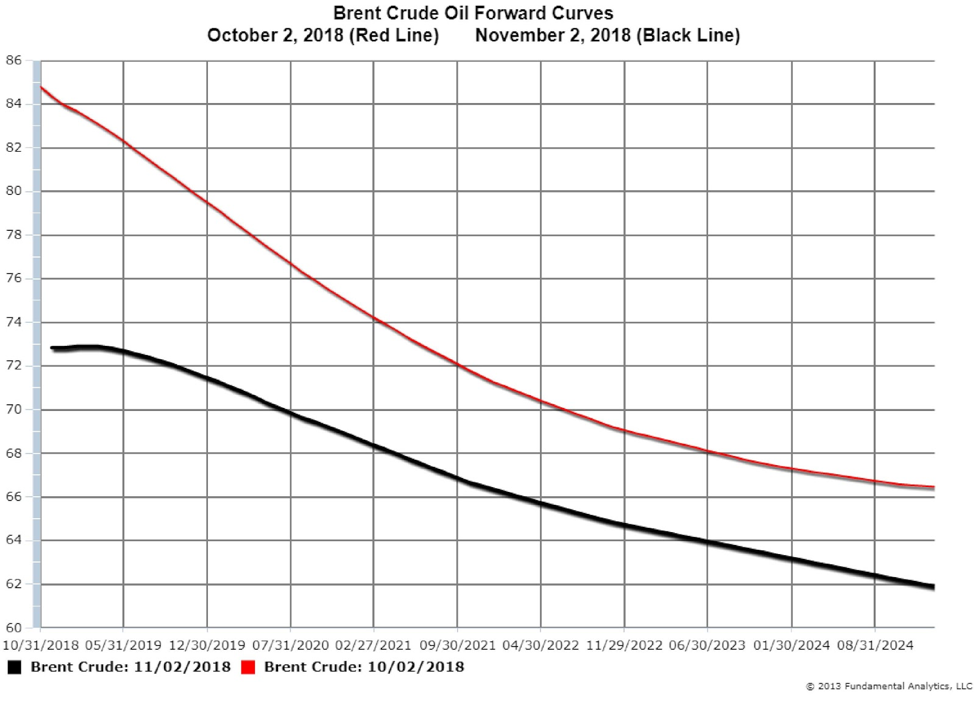
This cyclical change to lower prices is also illustrated by the Brent forward curve. On October 2, 2018, the forward curve was in complete backwardation (Chart 2, red line) indicating peaking prices or higher prices. By November 2, 2018, the forward curve was moving out of backwardation into contango (Chart 2, black line) indicating lower prices.
The market is rebalancing. Global consumption growth has started to slow in response to higher prices while output is rising in the United States, Russia, and OPEC. Lower spot prices and narrower spreads will reduce the potential of oversupply in 2019/2020. Lower prices should eventually restrain the excessive growth in output from OPEC and US shale producers.
Chart 1
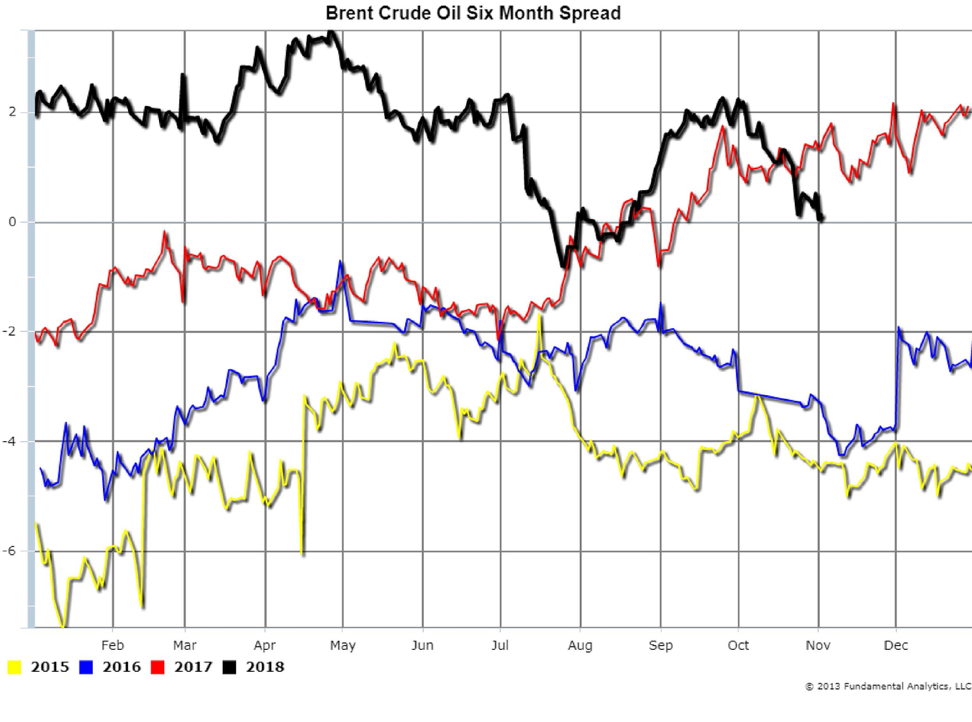
Chart 2
Grains
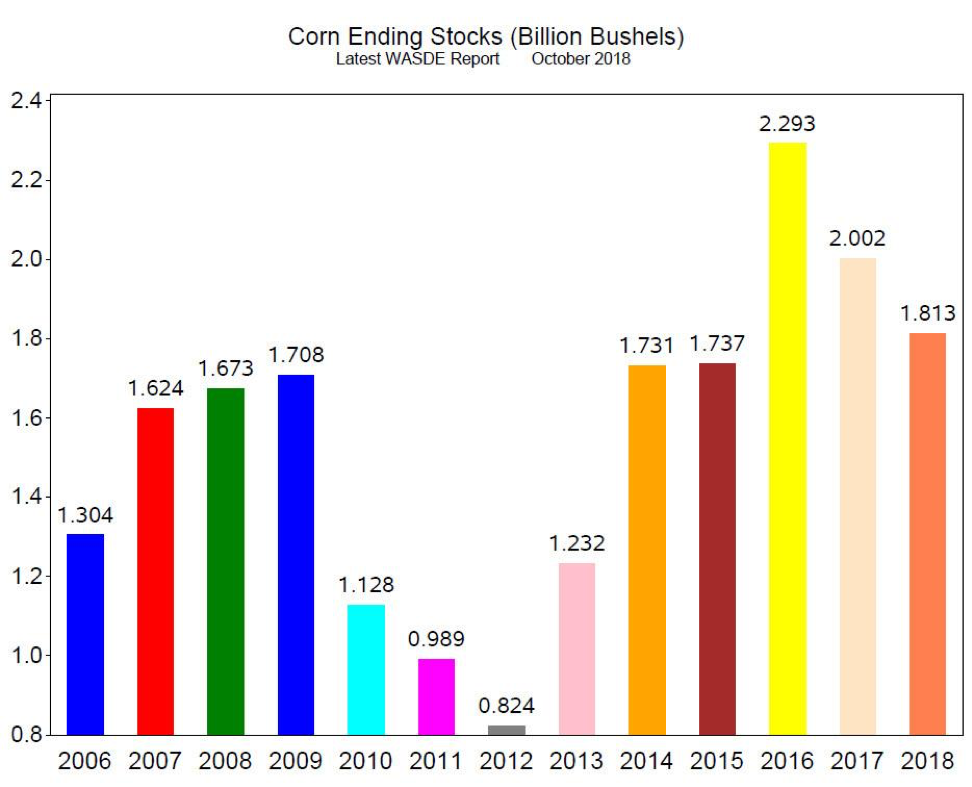
The USDA WASDE November report will be released Thursday. Producers are hoping for the November revisions from October to be supportive to prices. Two of the major data points are Yield in bushels per acre and Ending Stocks in billion bushels.
Regarding Corn, the October WASDE reported 180.7 bushels per acre (Chart 3, 2018) and the average estimate for the November report is 180.0 bushels per acre. Corn Ending Stocks in the October report was 1.813 billion bushels (Chart 4, 2018) and the average estimate for the November report is 179.6 billion bushels. A Yield of 180.0 bushels per acre is still a record high, but Ending Stocks of 179.6 is lower than the previous three years.
Corn prices have recovered from the lows in mid-September but are now range bound. We cannot recommend consideration of a long position at this time but believe there is upside potential if prices break out of the current trading range and trade above $3.80.
Chart 3
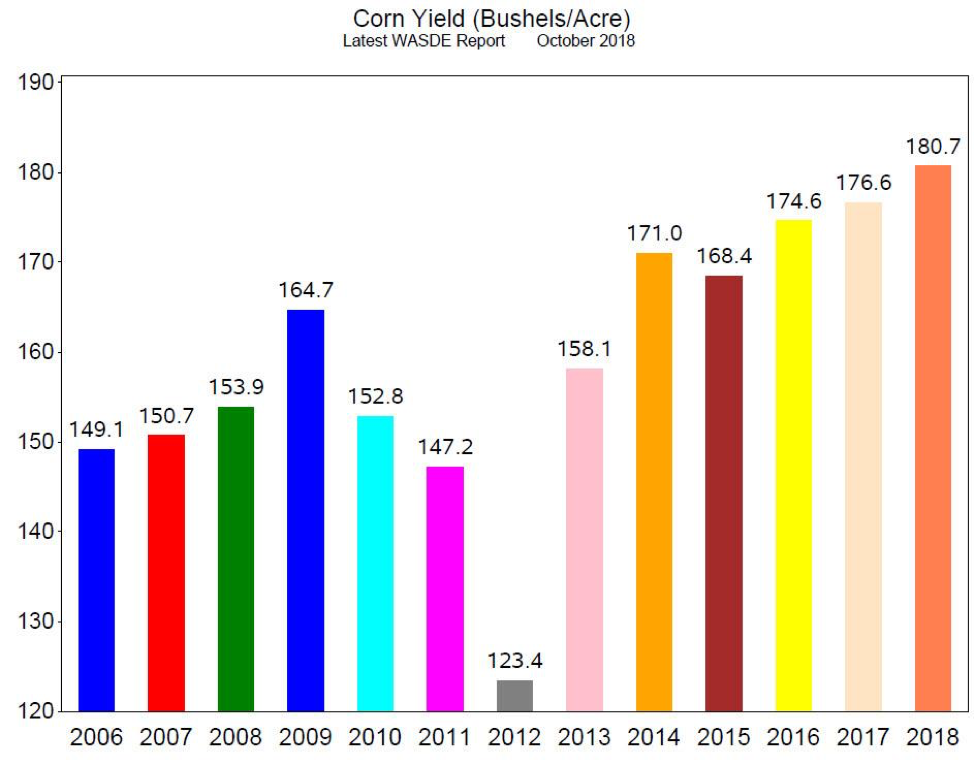
Chart 4
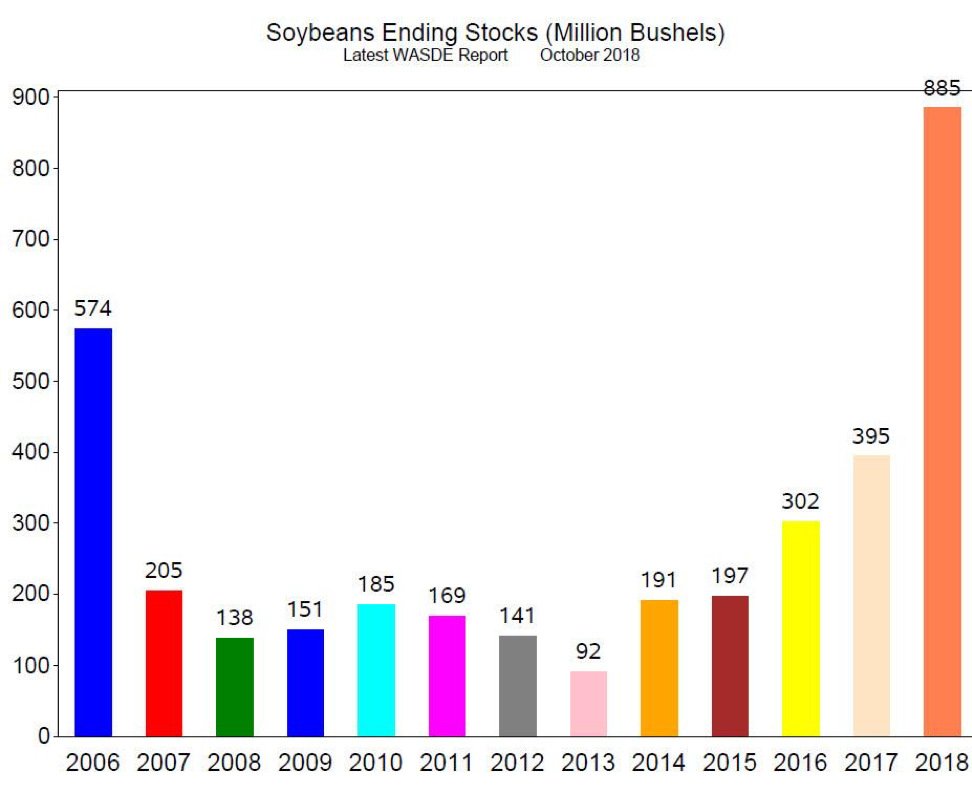
The October WASDE reported Soybeans Yield at 53.1 bushels per acre (Chart 5, 2018). The average estimate for the November report is 52.9 bushels per acre. Ending Stocks in the October report are 885 million bushels (Chart 6, 2018) while the average estimate is for 923 million bushels. Soybeans Yield is slightly reduced but remains at record level, and Ending Stocks are estimated to increase with the November report.
The data are bearish for soybeans prices. As with corn prices, soybean prices recovered from the lows in September, but we do not believe higher prices can be sustained. Especially with Chinese tariffs, exports to China dropped from over 30 metric tons per week in July and August to 1.2 metric tons per week in September and October; soybeans in US storage are piling up. Consequently, we recommend consideration of short positions in the outrights or spreads.
Chart 5
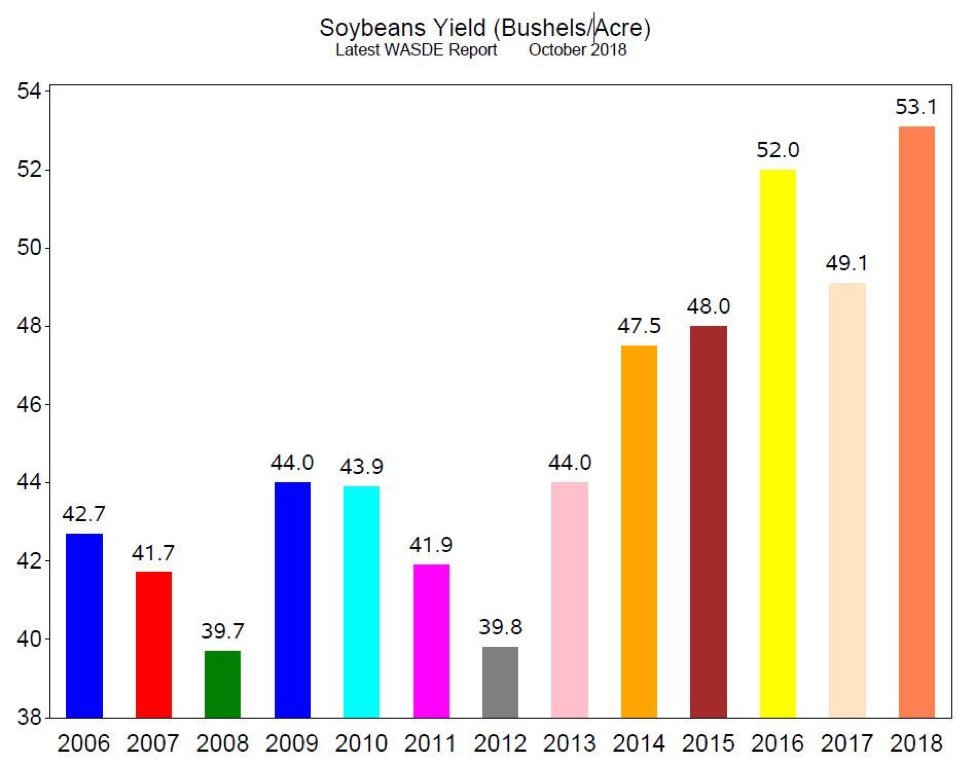
Chart 6