Dr. Ken Rietz
December 13, 2023
This is the second spreads issue, and plans for this series are becoming more definite. Each month, I will go over the crack spread and one other future spread. Since there are so many types of spreads, I will, for a while, pick a new type each month. Last month’s spread, the soybean crush spread, is called a commodity product spread, since we use a single commodity to create one or more products. The spread is the total value of the products minus the cost of the commodity. The crack spread is also a commodity product spread. This month, I will go over an intermarket spread, which is the difference between two related commodities, in this case, the wheat-corn spread, again one of the more common examples of this type of spread.
First, we cover the crack spread using the standard 3-2-1 ratios, starting with the graph. (I covered this spread in some detail in the original spread issue, dated October 5, 2023.)
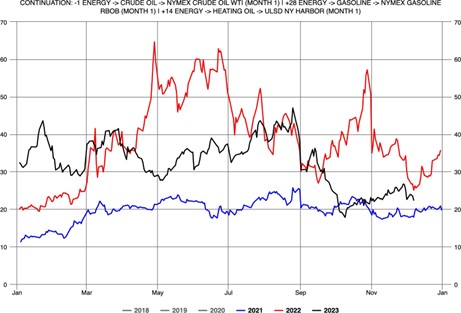
Figure 1: The crack spread for WTI crude since 2021, in dollars per barrel
You will notice the crack spread has gone up since the last spreads issue, but has turned down recently, with a small net increase. This explains, but only in part, the lower gasoline prices in the US recently, but warns that this trend might be turning.
Now we move to the wheat-corn futures spread. There are several reasons that an intermarket spread could be useful, mainly to traders. Here are advantages to this kind of a spread. (1) It somewhat neutralizes overall market movements, since you are only concerned about the difference in two market prices. (2) It is much cheaper than either one of the commodities. (3) This can easily become an option spread. (4) It is much less risky than either one of the commodities, and therefore has a much smaller margin. The fact that it is less risky doesn’t mean there is no risk; risk is inherent in trading. But if you are a seasoned technical analyst, the wheat-corn spread graph can guide which one to buy and which one to sell.
Here is the graph of the wheat-corn spread. (There is something of a convention with an intermarket spread: you buy the first-named commodity and sell the second-named commodity.)
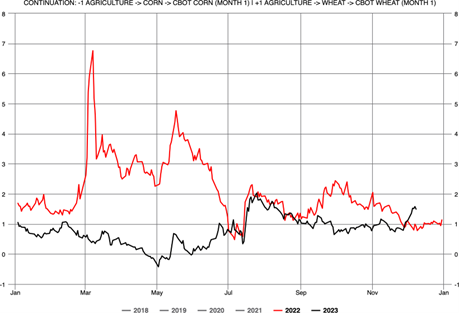
Figure 2: The wheat-corn spread since 2021, in dollars per bushel
One example of a trade occurs in May. Wheat normally costs more than corn, but in May, that reversed slightly, shown by the graph dropping below zero. A safe trade would buy wheat and sell corn at that point, and wait for the usual order to resume. Of course, this should not be considered financial advice and any trading needs to be done in consultation with a financial advisor.
Personal note: Several people have contacted me regarding the spreads series. One person went over, very patiently and kindly, how I messed up the crack spread last time and showed me how to fix it. It should be correct now. My apologies to all. Another person contacted me several times, once with a nice list of potential spreads, and once with an explanation of some of the limitations of using the NYMEX WTI crude price as representative of Crude Oil. We are considering your suggestions. I thank both of you. And other people, please feel free to contact me with corrections, suggestions, or questions!