Commodities Market Update
July 18, 2018
Energy
Despite recent short term drops in the price of Crude Oil, the market structure is one of backwardation, where the deferred months are priced lower than the front months. As shown by the Forward Curve below (Chart 1), Crude Oil prices as of Monday, July 16, 2018, started with the August Crude settled at $68.06. The next contract, September Crude, settled at $67.07. October Crude settled at 65.66, and so on. The Forward Curve plots the descending prices of the deferred months down to $52 out to the year 2025.
Chart 1
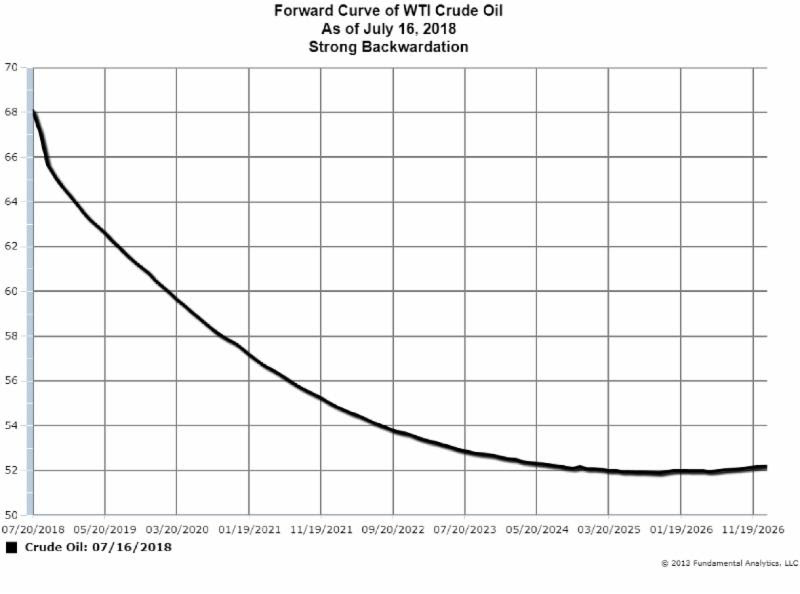
A backwardated structure indicates the market is concerned about near-term supplies and has bid up the front of the market. When the front month contract, in this case the August contract, expires in three days, the new front month contract, September, is usually pressured upward to “fill the gap” between the two contracts.
So while the current September Crude Oil contract dropped by a significant $2.88 on Monday (Chart 2, the black line), the longer-term prospects are bullish as long as the Forward Curve remains backwardated.
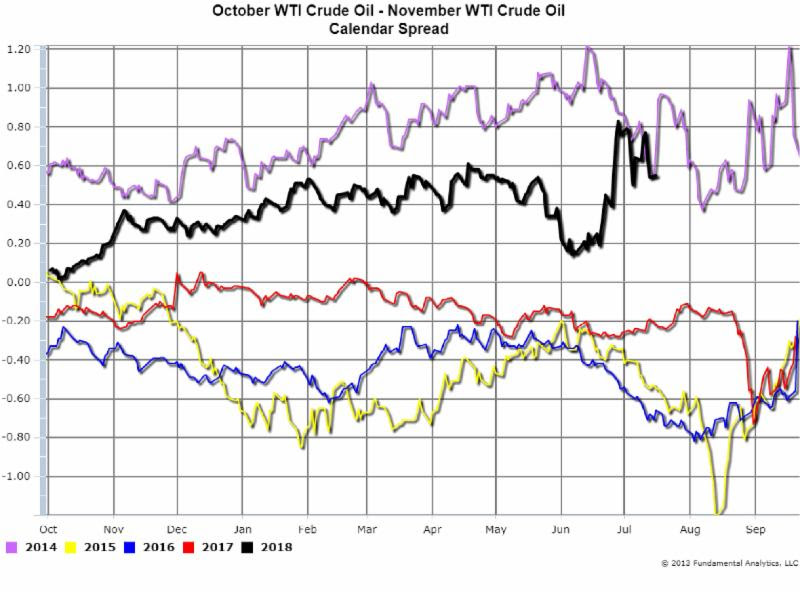
A trader could go long the September contract or go long a calendar spread such as, for example, the calendar spread of October minus November (Chart 3, black line).
Should the Forward Curve start to lose it steepness, moving to a flatter Forward Curve, that would be an indicator of a decreasing bullish market and a signal to consider exiting a bull trade.
Chart 2
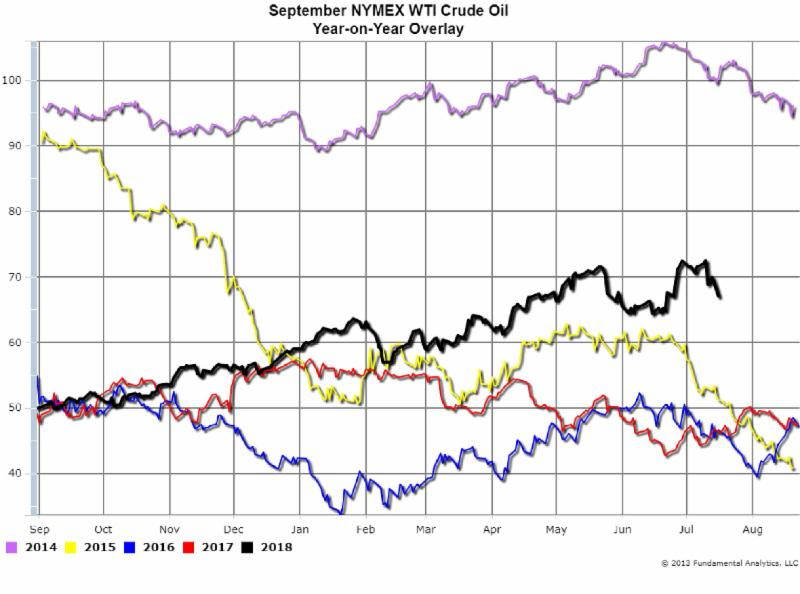
Chart 3
Funds Continue Selling Corn and the Market is Bearish
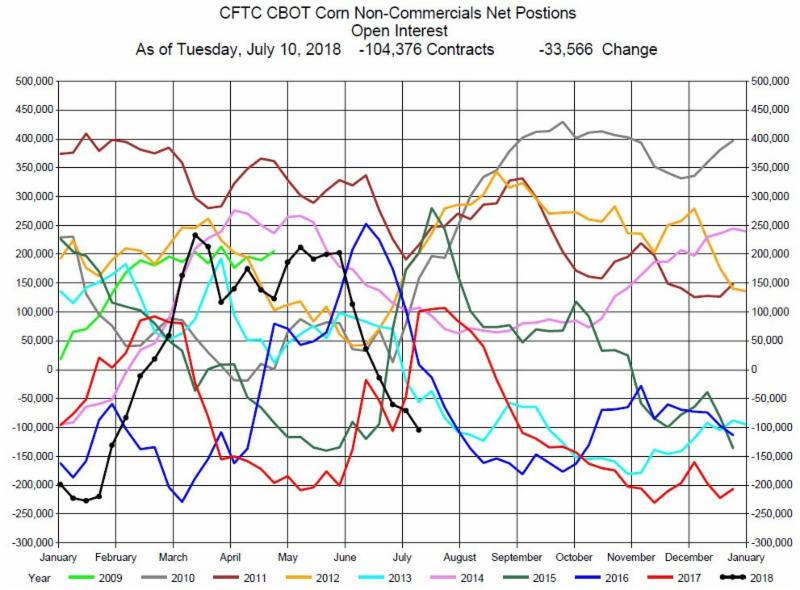
In the latest CFTC report for the week ending July 10th, the funds were net sellers of a significant 33,586 contracts to a short position of -104,378 contracts (Chart 4). There is a lead-lag relationship between Funds position and price. Funds will follow price regarding their Net Positions, but also the Funds’ significant net position pressures prices.
Chart 4
The market remains in a bearish mode as the US/Chinese trade talks continue. The market has sold off hard over the last month, and there may be an occasional short covering rally. The latest USDA Monday report rates 72% of the corn crop in good to excellent condition, indicating the potential for oversupply at harvest, also contributing to the bearish sentiment on corn prices.
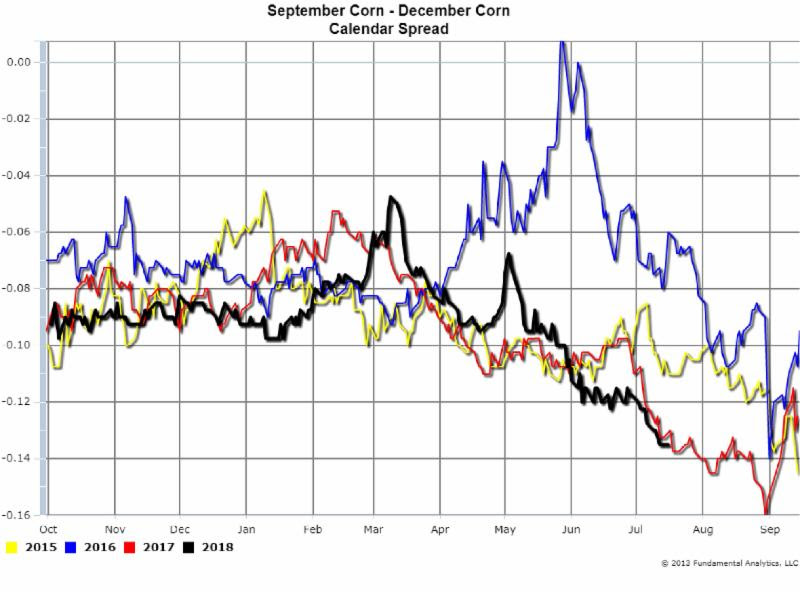
For the trader, shorting the December Corn contract (Chart 5) has good downside potential. And the trader may consider shorting the September-December Corn calendar spread (Chart 6) which has less volatility.
Chart 5

Chart 6
For more insights and analysis or to find out about our free trial offer, go to www.fundamentalanalytics.com
Follow us on Twitter @fundanalytics or on LinkedIn
Regards,
The Fundamental Analytics Team