Commodity Market Update August 28,2018
Energy
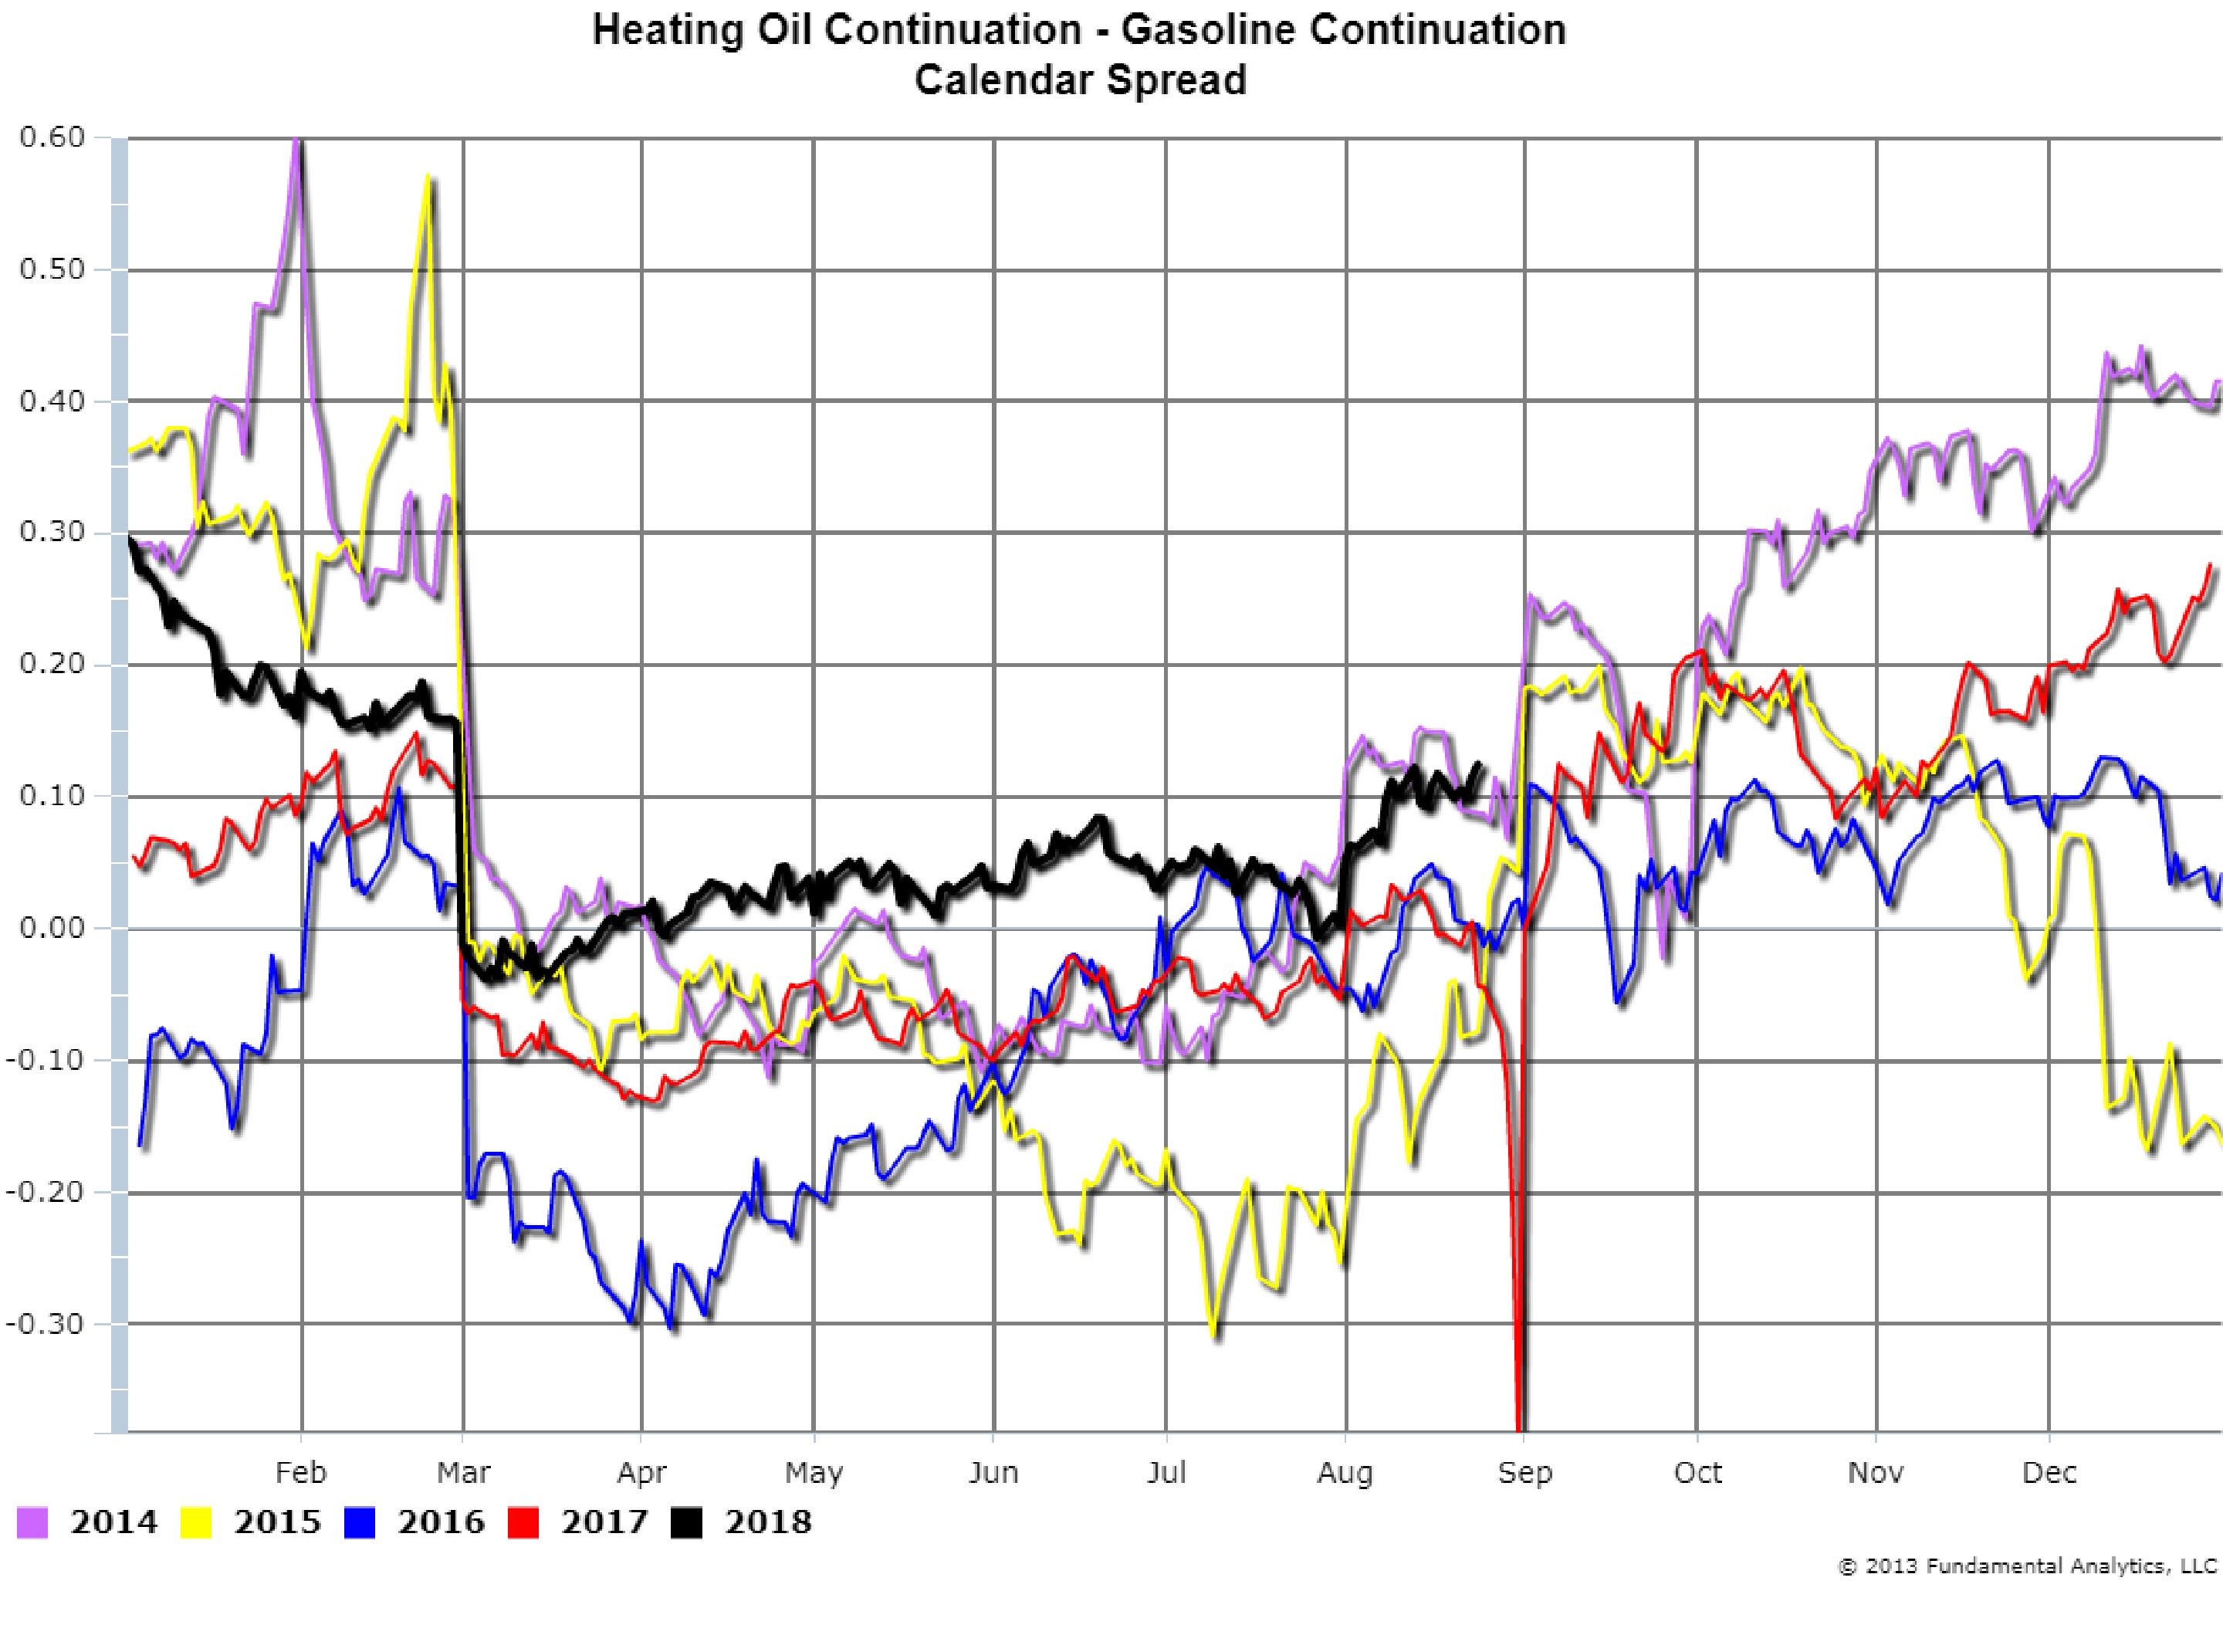
A comparison of the price of Heating Oil to the price of Gasoline in futures is often referred to as the “Heat-to-Gas Spread.” Chart 1 is a continuation overlay plot of the Heat-to-Gas Spread illustrating the seasonality of the spread. During the summer driving season Gasoline prices are usually higher than Heating Oil so the spread is negative, and during the fall/winter heating season the spread is usually positive. This year’s summer driving season has been an exception with record diesel fuel demand from increased truck traffic causing higher prices than gasoline (black line).
We note that the dramatic drop in September 2017 (red line) is not a data error. Hurricane Fred hit the Houston, Texas region at the end of August causing severe wide-spread flooding. Major Gulf Coast refineries were flooded and shut down. This created a shortage of gasoline so prices spiked.
Chart 1
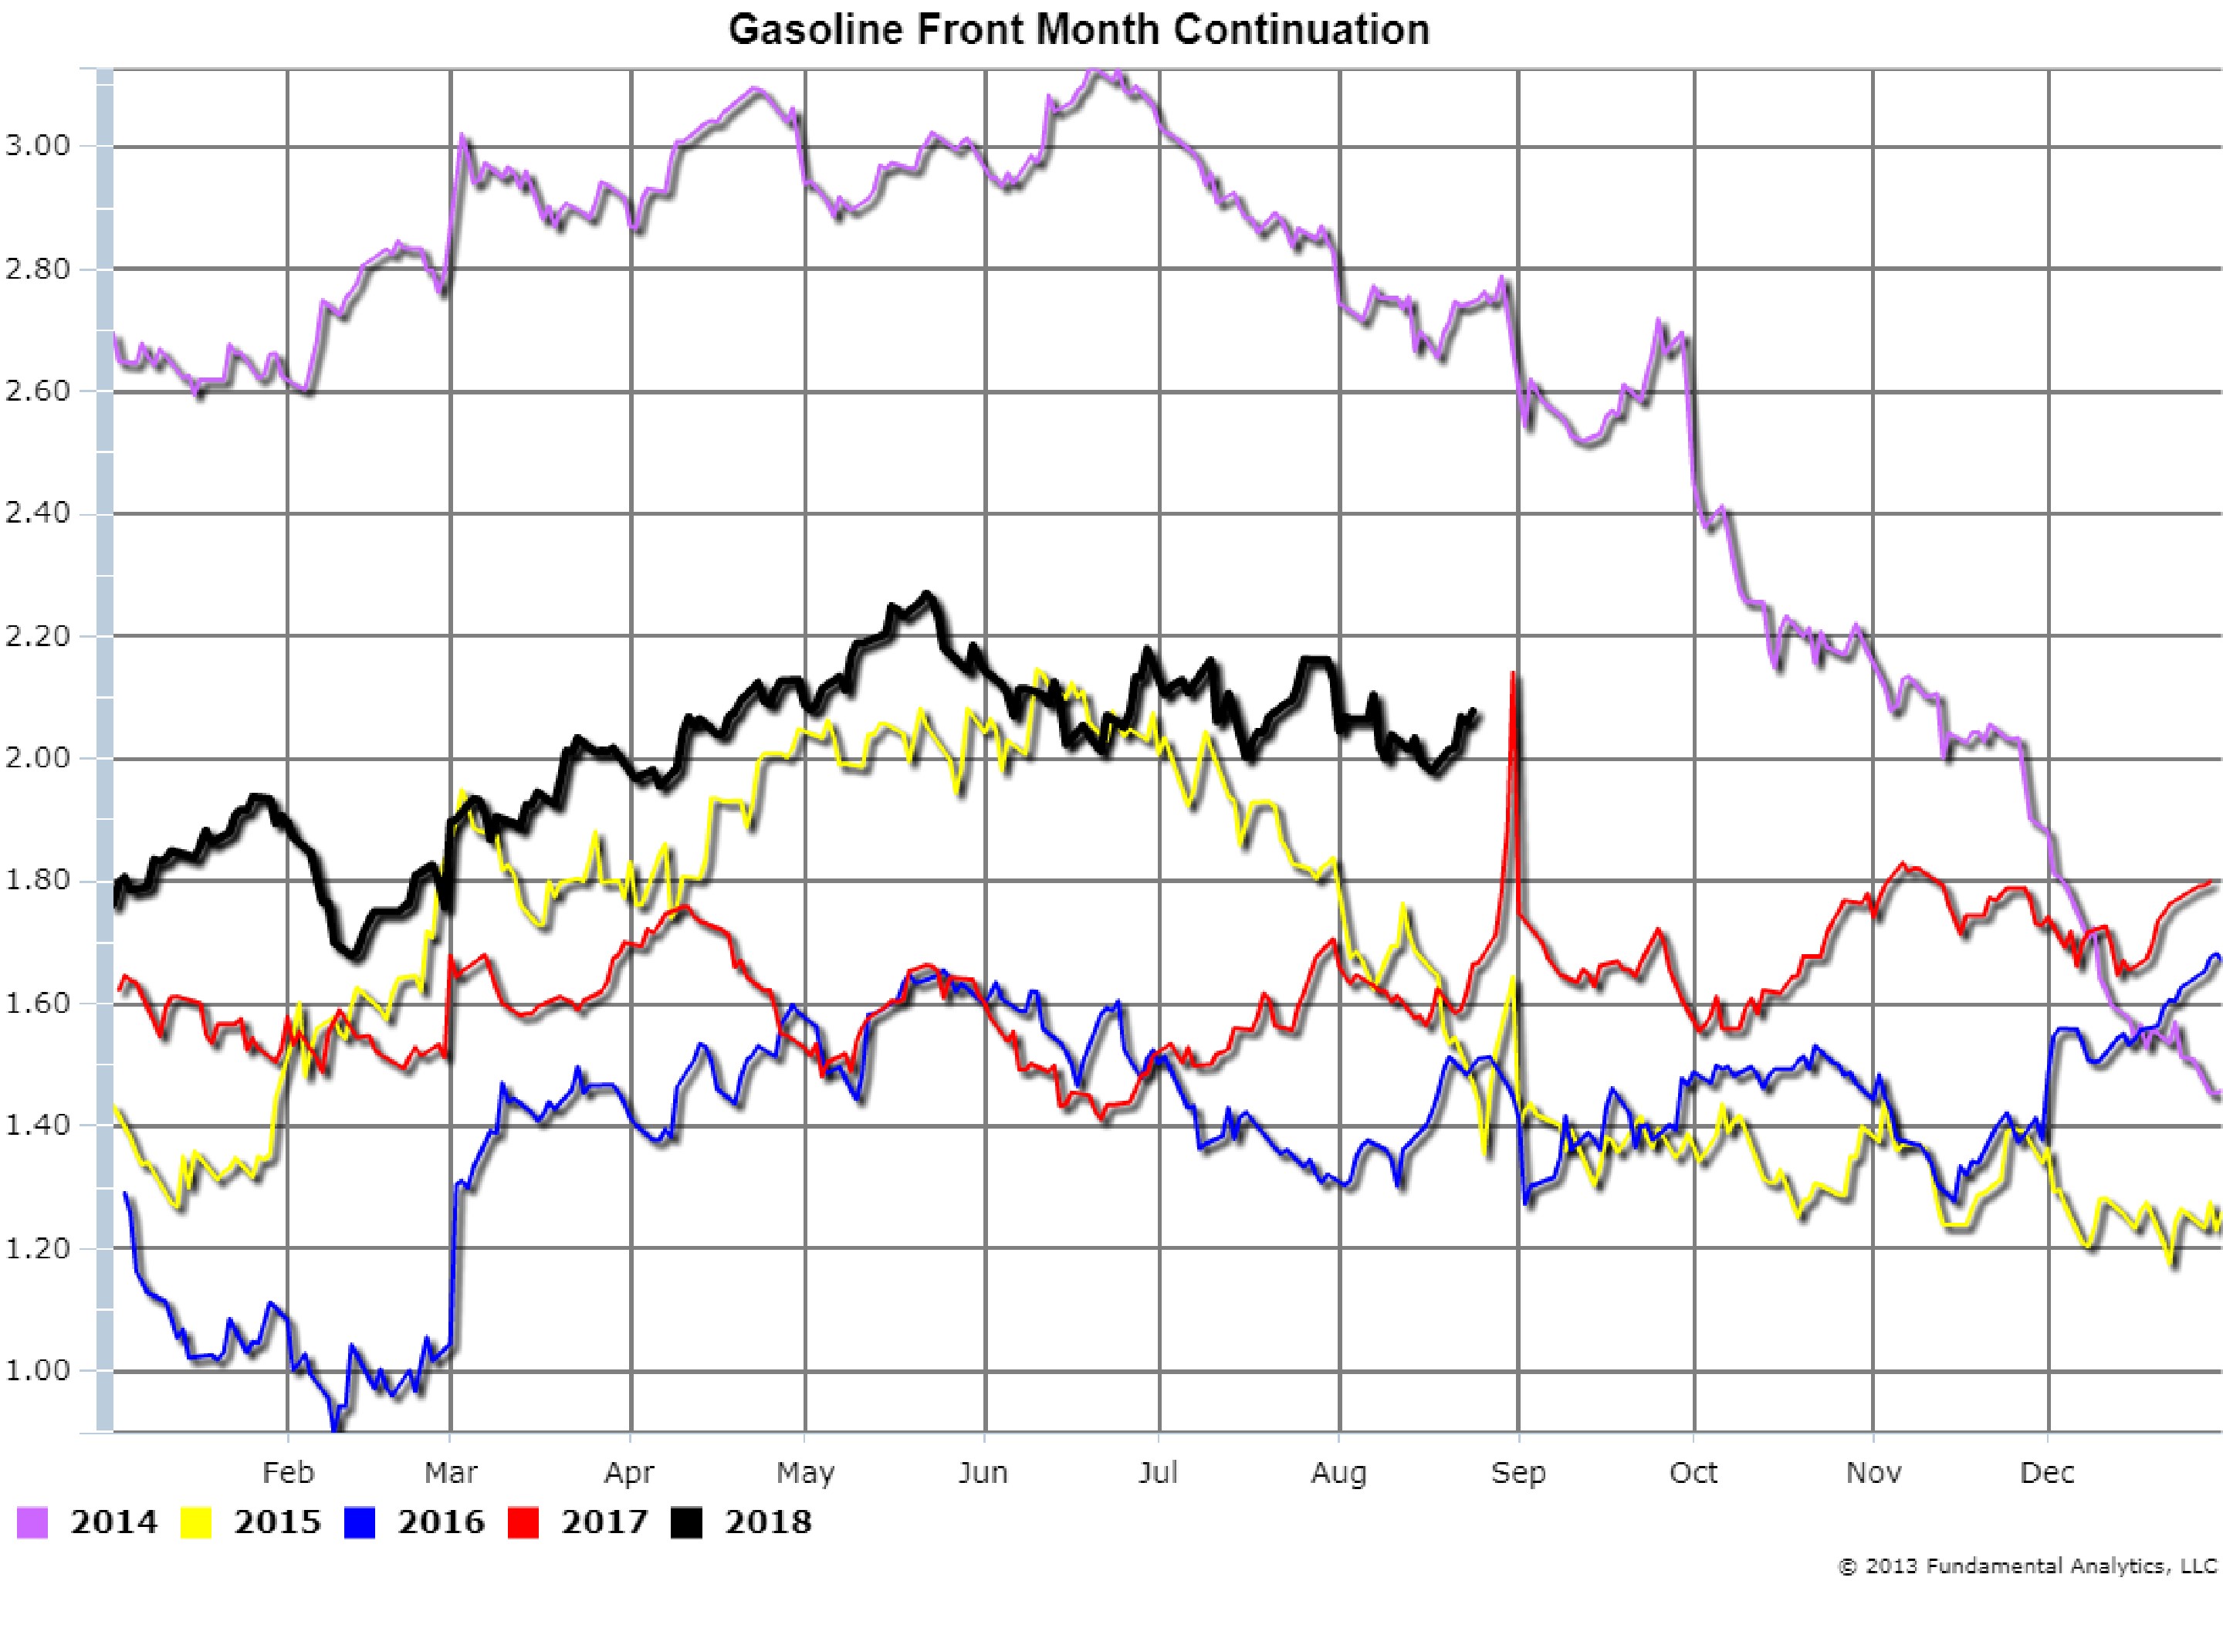
The gasoline price is shown in Chart 2 (red line) with the price jumping over 50 cents a gallon in a matter of days.
Chart 2
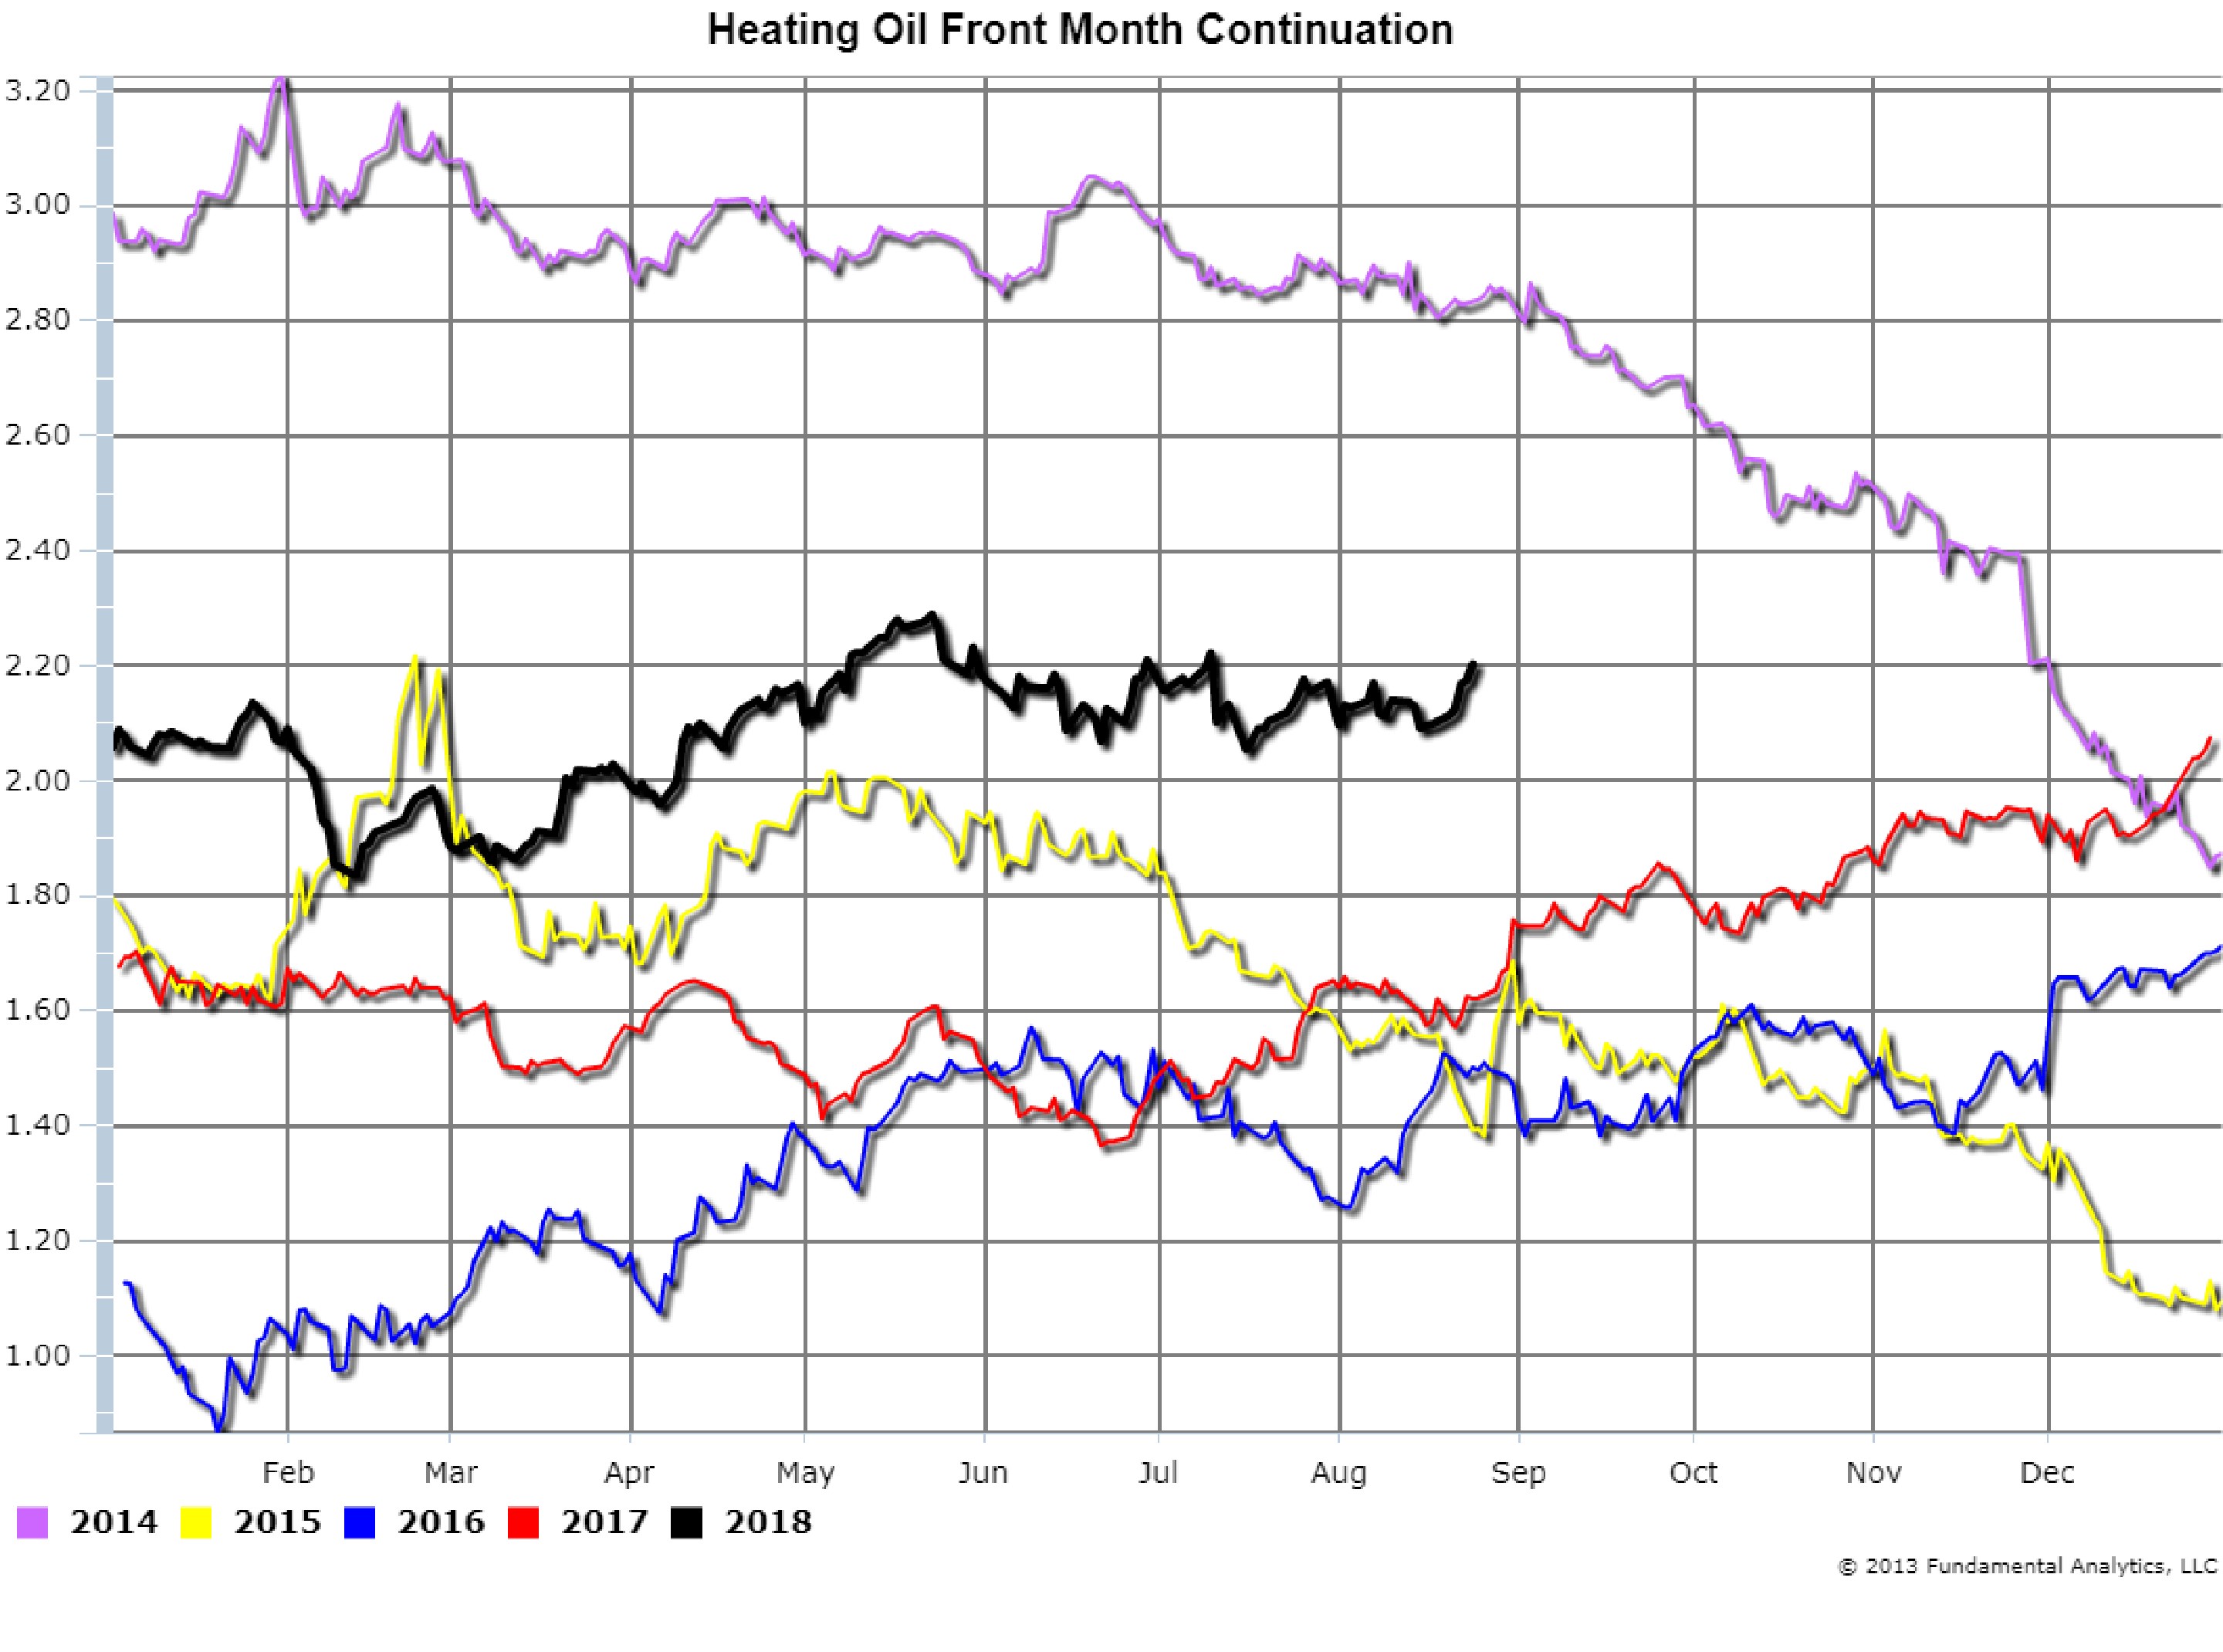
In contrast, the price of heating oil (diesel fuel) increased by only 10 cents a gallon at the time (Chart 3, red line).
Chart 3
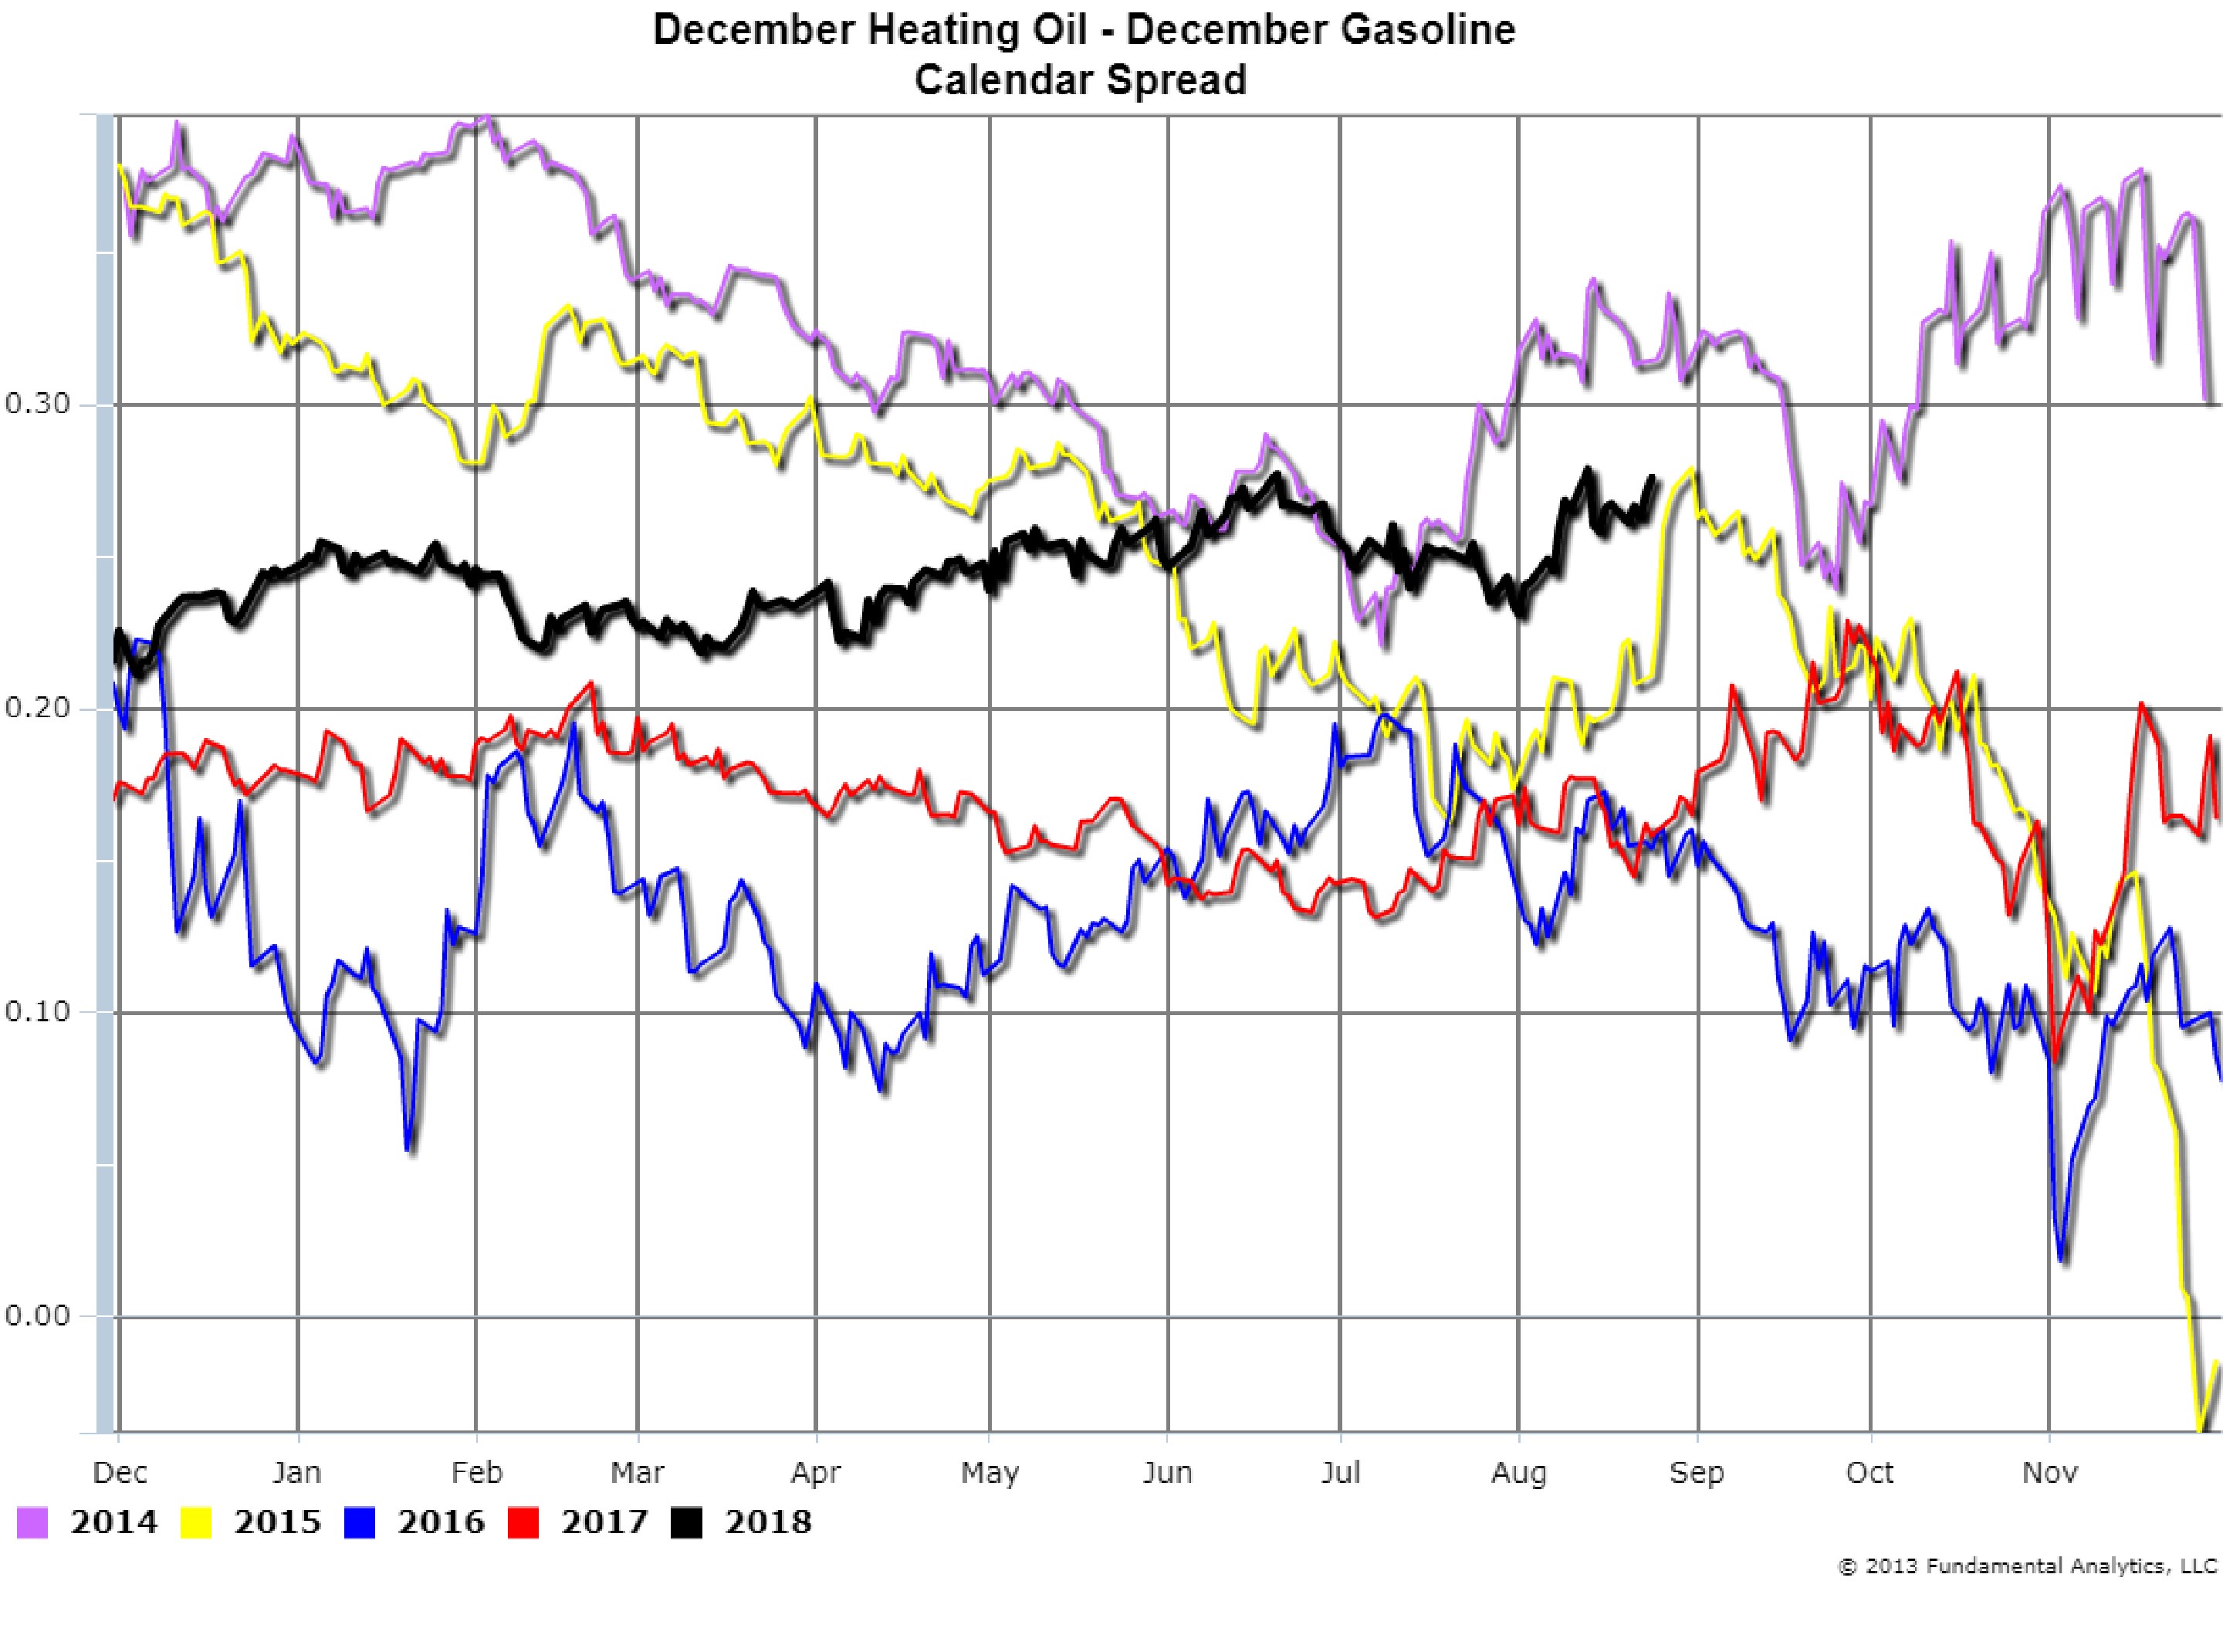
From a trading perspective we consider the December Heat-to-Gas calendar spread as the December contract trades through November (Chart 4). With the exception of 2014 (violet line), the spread actually weakens going into November. We suggest considering this spread for the opportunity to short it sometime in September.
Chart 4
Grains
Soybeans prices continue to be pressured by a good crop season with record high yields and no resolution of the US-China trade negotiations. The soybeans calendar spreads continue to weaken as the nearby contracts are decreasing faster than the deferred contracts. For example, as of Friday, August 24, 2018, the January-March Soybeans calendar spread was at -13.25 cents (Chart 1, black line).
Chart 1
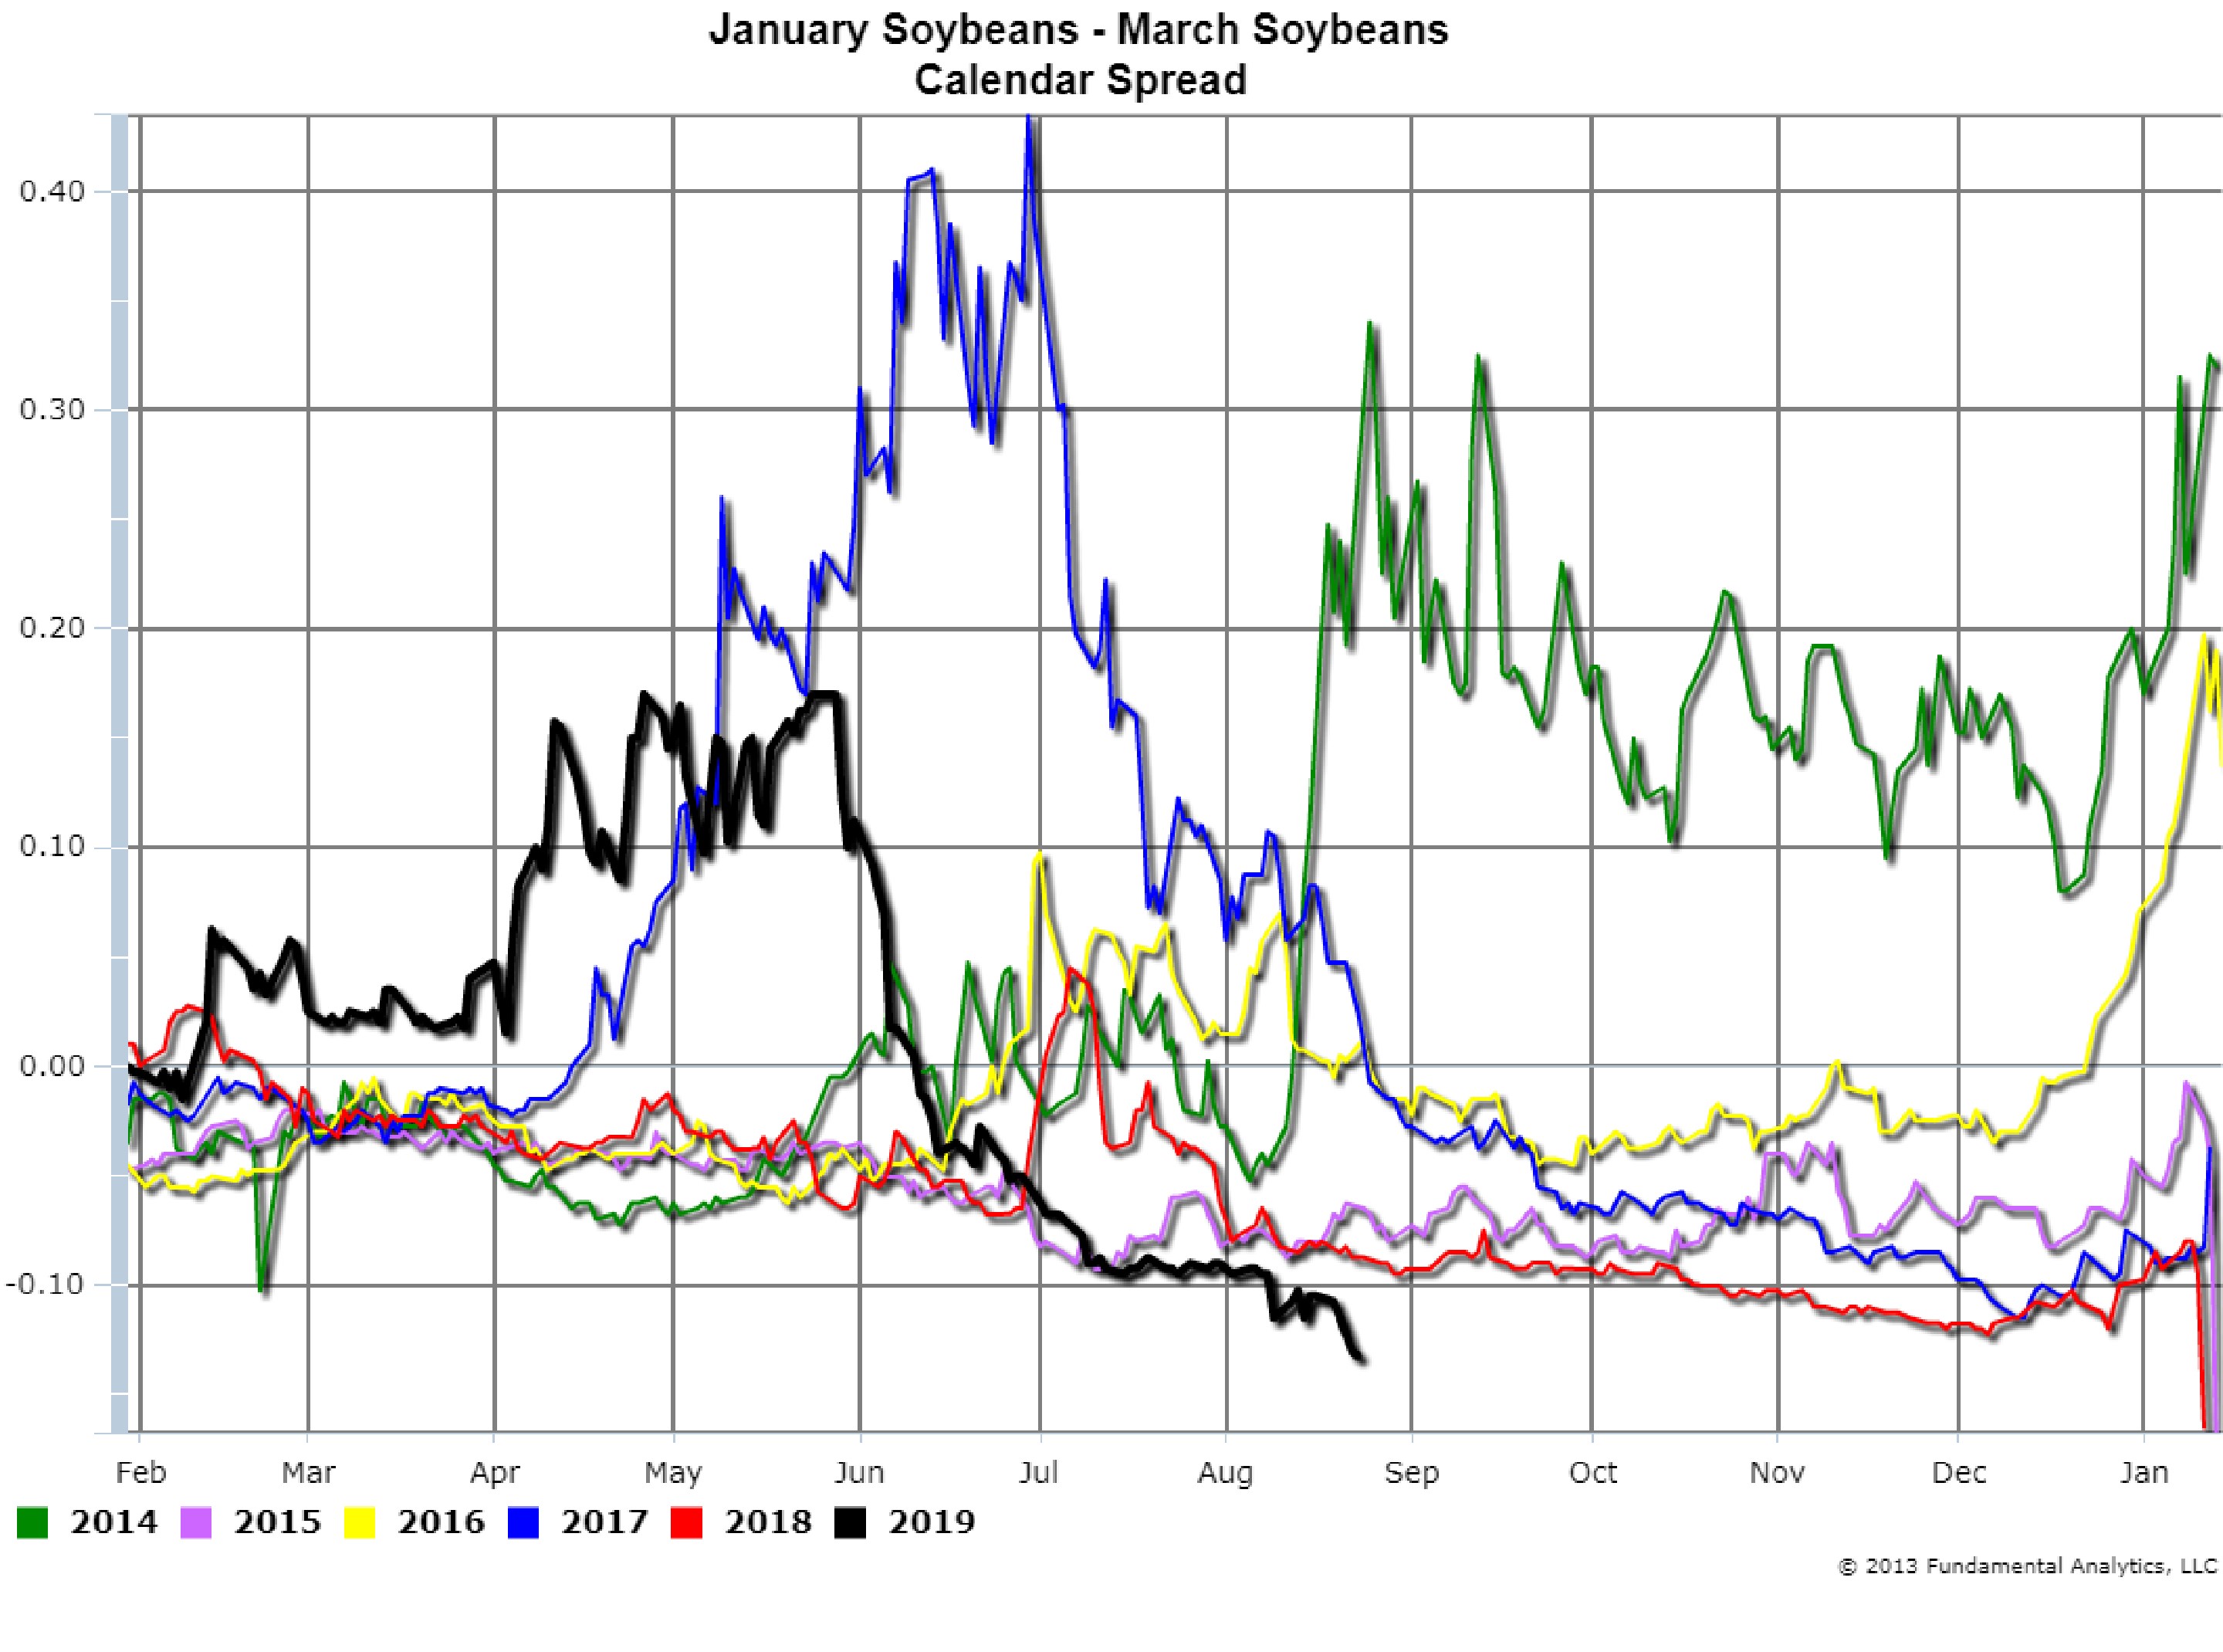
Table 1 is a portion of a soybeans prices Spread Matrix table showing pairwise calendar spreads. The values are all positive as the nearby month is subtracted from the deferred month to show how much greater the deferred months are to the nearby months. For example, as of August 24, 2018
March 2019 – January 2019 = $8.8125 -$8.6800 = $0.1325
Table 1
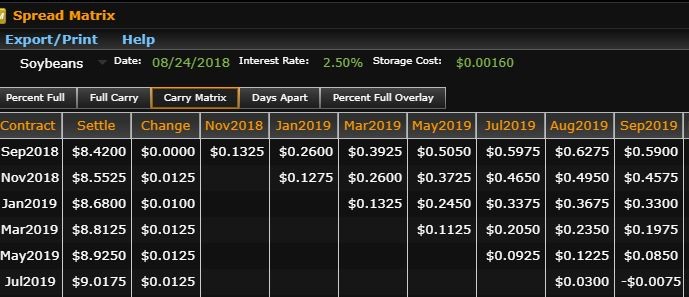
Table 2 is a portion of the Full Carry matrix showing the pairwise costs of buying a nearby month contract and holding it to expiration, and then simultaneously selling it to cover the short position in the deferred month. Full Carry is computed using the daily Storage Cost for holding the soybeans ($0.00160) and the annual Interest Rate for the cost of money (2.5%).
Table 2
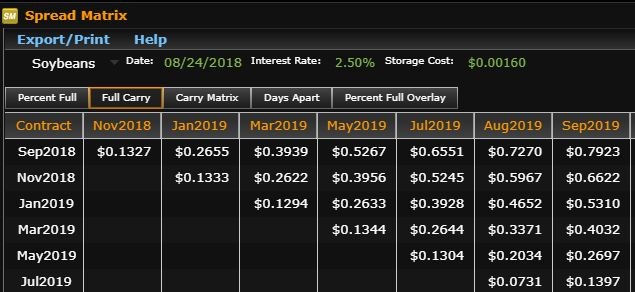
Table 3 is the ratio of the Calendar Spread to the Full Carry expressed as a percent:
1.02 = 0.1325/0.1294
Table 3
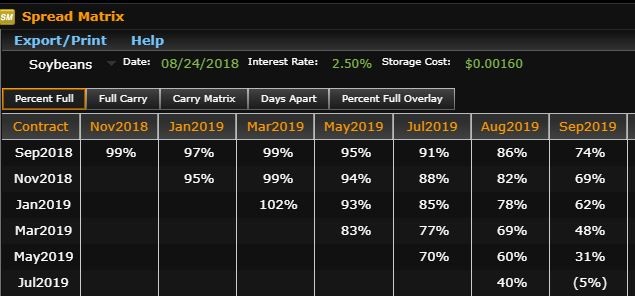
When calendar spreads are close to or greater than full carry, then producers are incentivized to store soybeans because the producer can sell the soybeans in a later month with essentially guaranteed profit.
When the spreads are close to or greater than full carry, that suggests more downward pressure on prices. For the speculator this is the opportunity to sell the spread which means going short the January 2019 contract and going long the March 2019 contract.
For more information contact joel.fingerman@fundamentalanalytics.com