July 24, 2018 | by Joel Fingerman
Corn
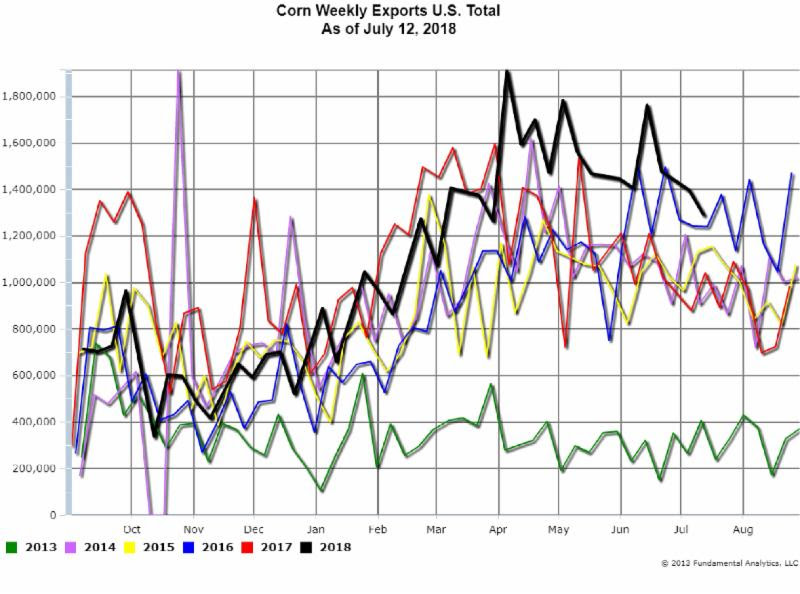
The latest Corn Weekly Export Sales reported Exports for the week ending July 12 at 1,293,000 metric tons (Chart 1 below). This is a decline of 103,600 metric tons but less than the Reuters expectations of a 200,000 metric ton decline. Despite the decline, the Export Sales remain at record highs for this time of the year, as shown by the black line for 2018 . This Export Sales report supported recent upward price moves as the Corn futures market had become highly oversold when prices dropped from $4.21 to $3.60 by July 1 (Chart 2 below, black line).
Chart 1
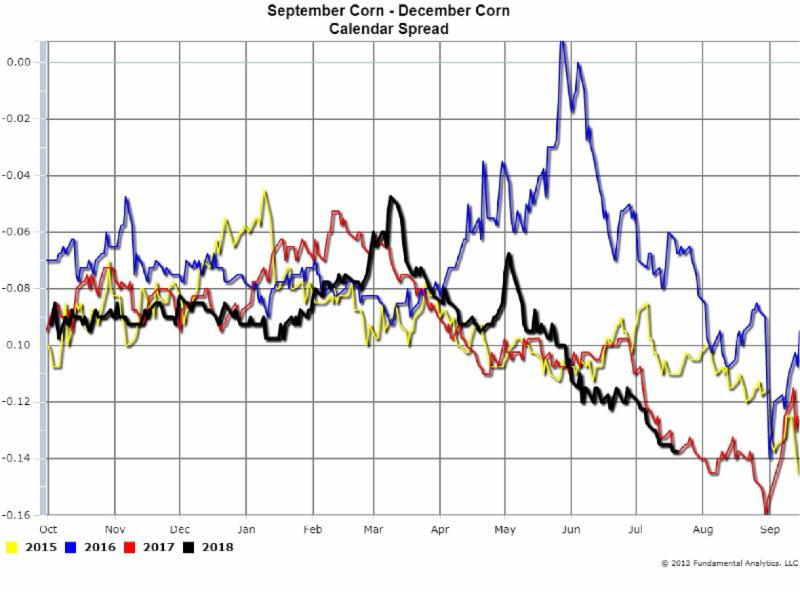
The December Corn contract has moved up by nearly 13.5 cents during this price rise (Chart 2), but interestingly, the September – December Corn calendar spread was basically unchanged (Chart 3) as the back months of the forward curve moved up as much as the front months. The next CFTC report will show if this price rally is due to short covering or new longs in the market.
Chart 2
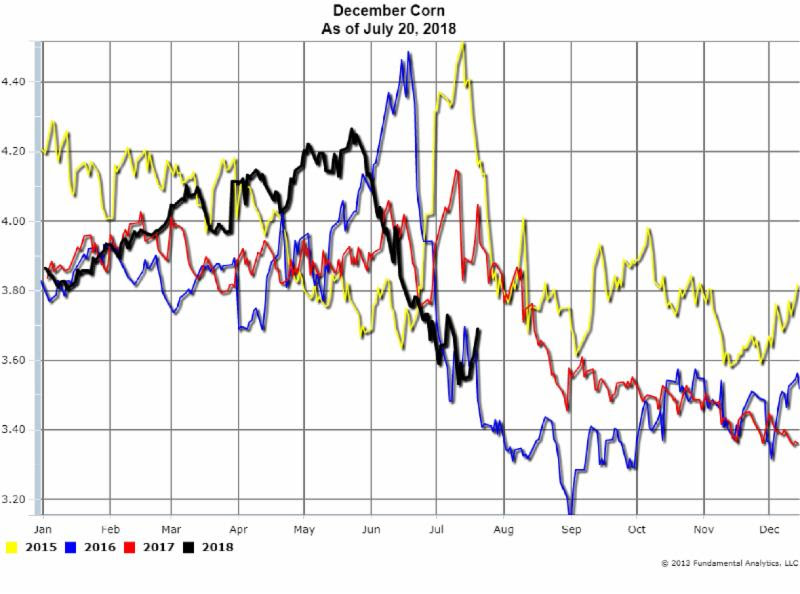
Chart 3
Traders, producers, and buyers will now watch to see if this just a short term bull move in prices in a bear market or the start of a bull market trend.
Energy
Crude Oil prices have rallied despite the recent large increase in Crude Oil Stocks. The latest DOE report for the week ending July 13, 2018 had Crude Stocks increasing by a large, and unexpected, 5.8 million barrels (Chart 4).
Chart 4
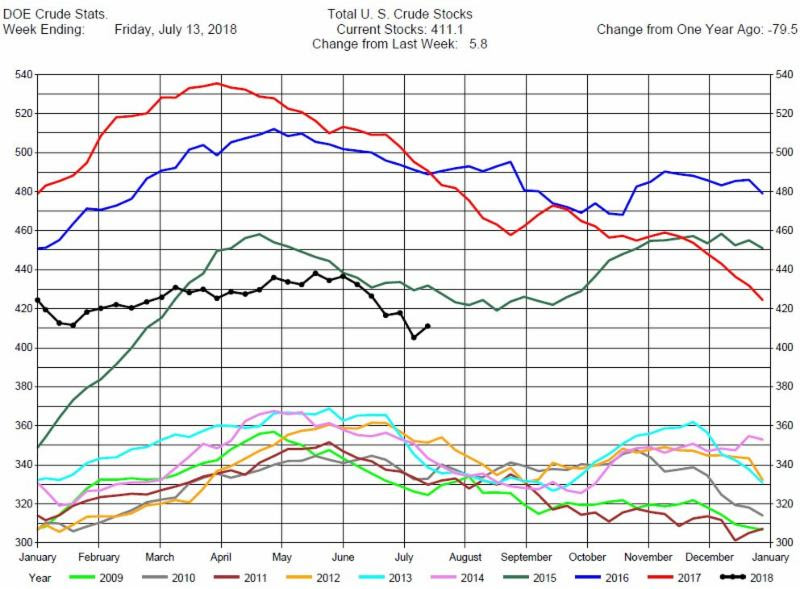
A large increase in Crude Oil Stocks usually puts downward pressure on prices. Yet prices have rallied in part due to a weakening dollar (commodity prices tend to strengthen when the U. S. dollar weakens) and lower expected Crude Oil exports from Saudi Arabia. And while the Crude Oil Stocks increase was large, Stocks remain lower than the last 3 years.
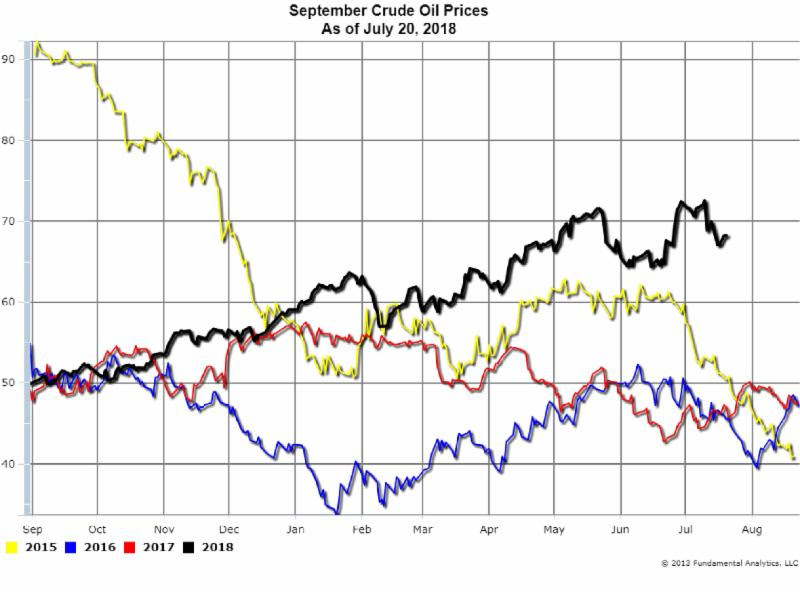
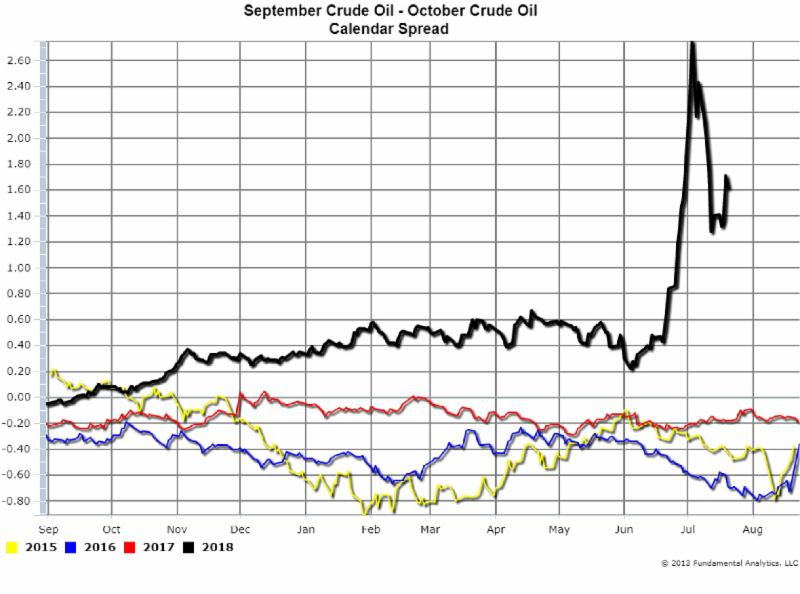
The recent rise in Crude Oil prices, after the major decline, is shown below by the September Crude Oil Prices (Chart 5, black line). The major decline and recent rise in prices is more dramatically illustrated by the calendar spread of September Crude minus October Crude (Chart 6, black line).
Chart 5
When Crude prices were peaking at the beginning of July, the Sep-Oct Crude Spread was $2.70. Then when Crude prices dropped the Spread lost more than half its value at $1.30. It has since recovered to the $1.60 level. We also note that this Calendar Spread is significantly higher than the last three years, another measure of the steepness of the forward curve, a further indication of a bull market.
Chart 6
For the trader this suggests bull positions. For the producer this suggests lifting hedges, and for buyers this suggests maintaining or establishing hedges.
For more insights and analysis or to find out about our free trial offer, go to www.fundamentalanalytics.com
Follow us on Twitter @fundanalytics or on LinkedIn
Regards,
The Fundamental Analytics Team