Commodity Market Update October 17, 2018
Energy
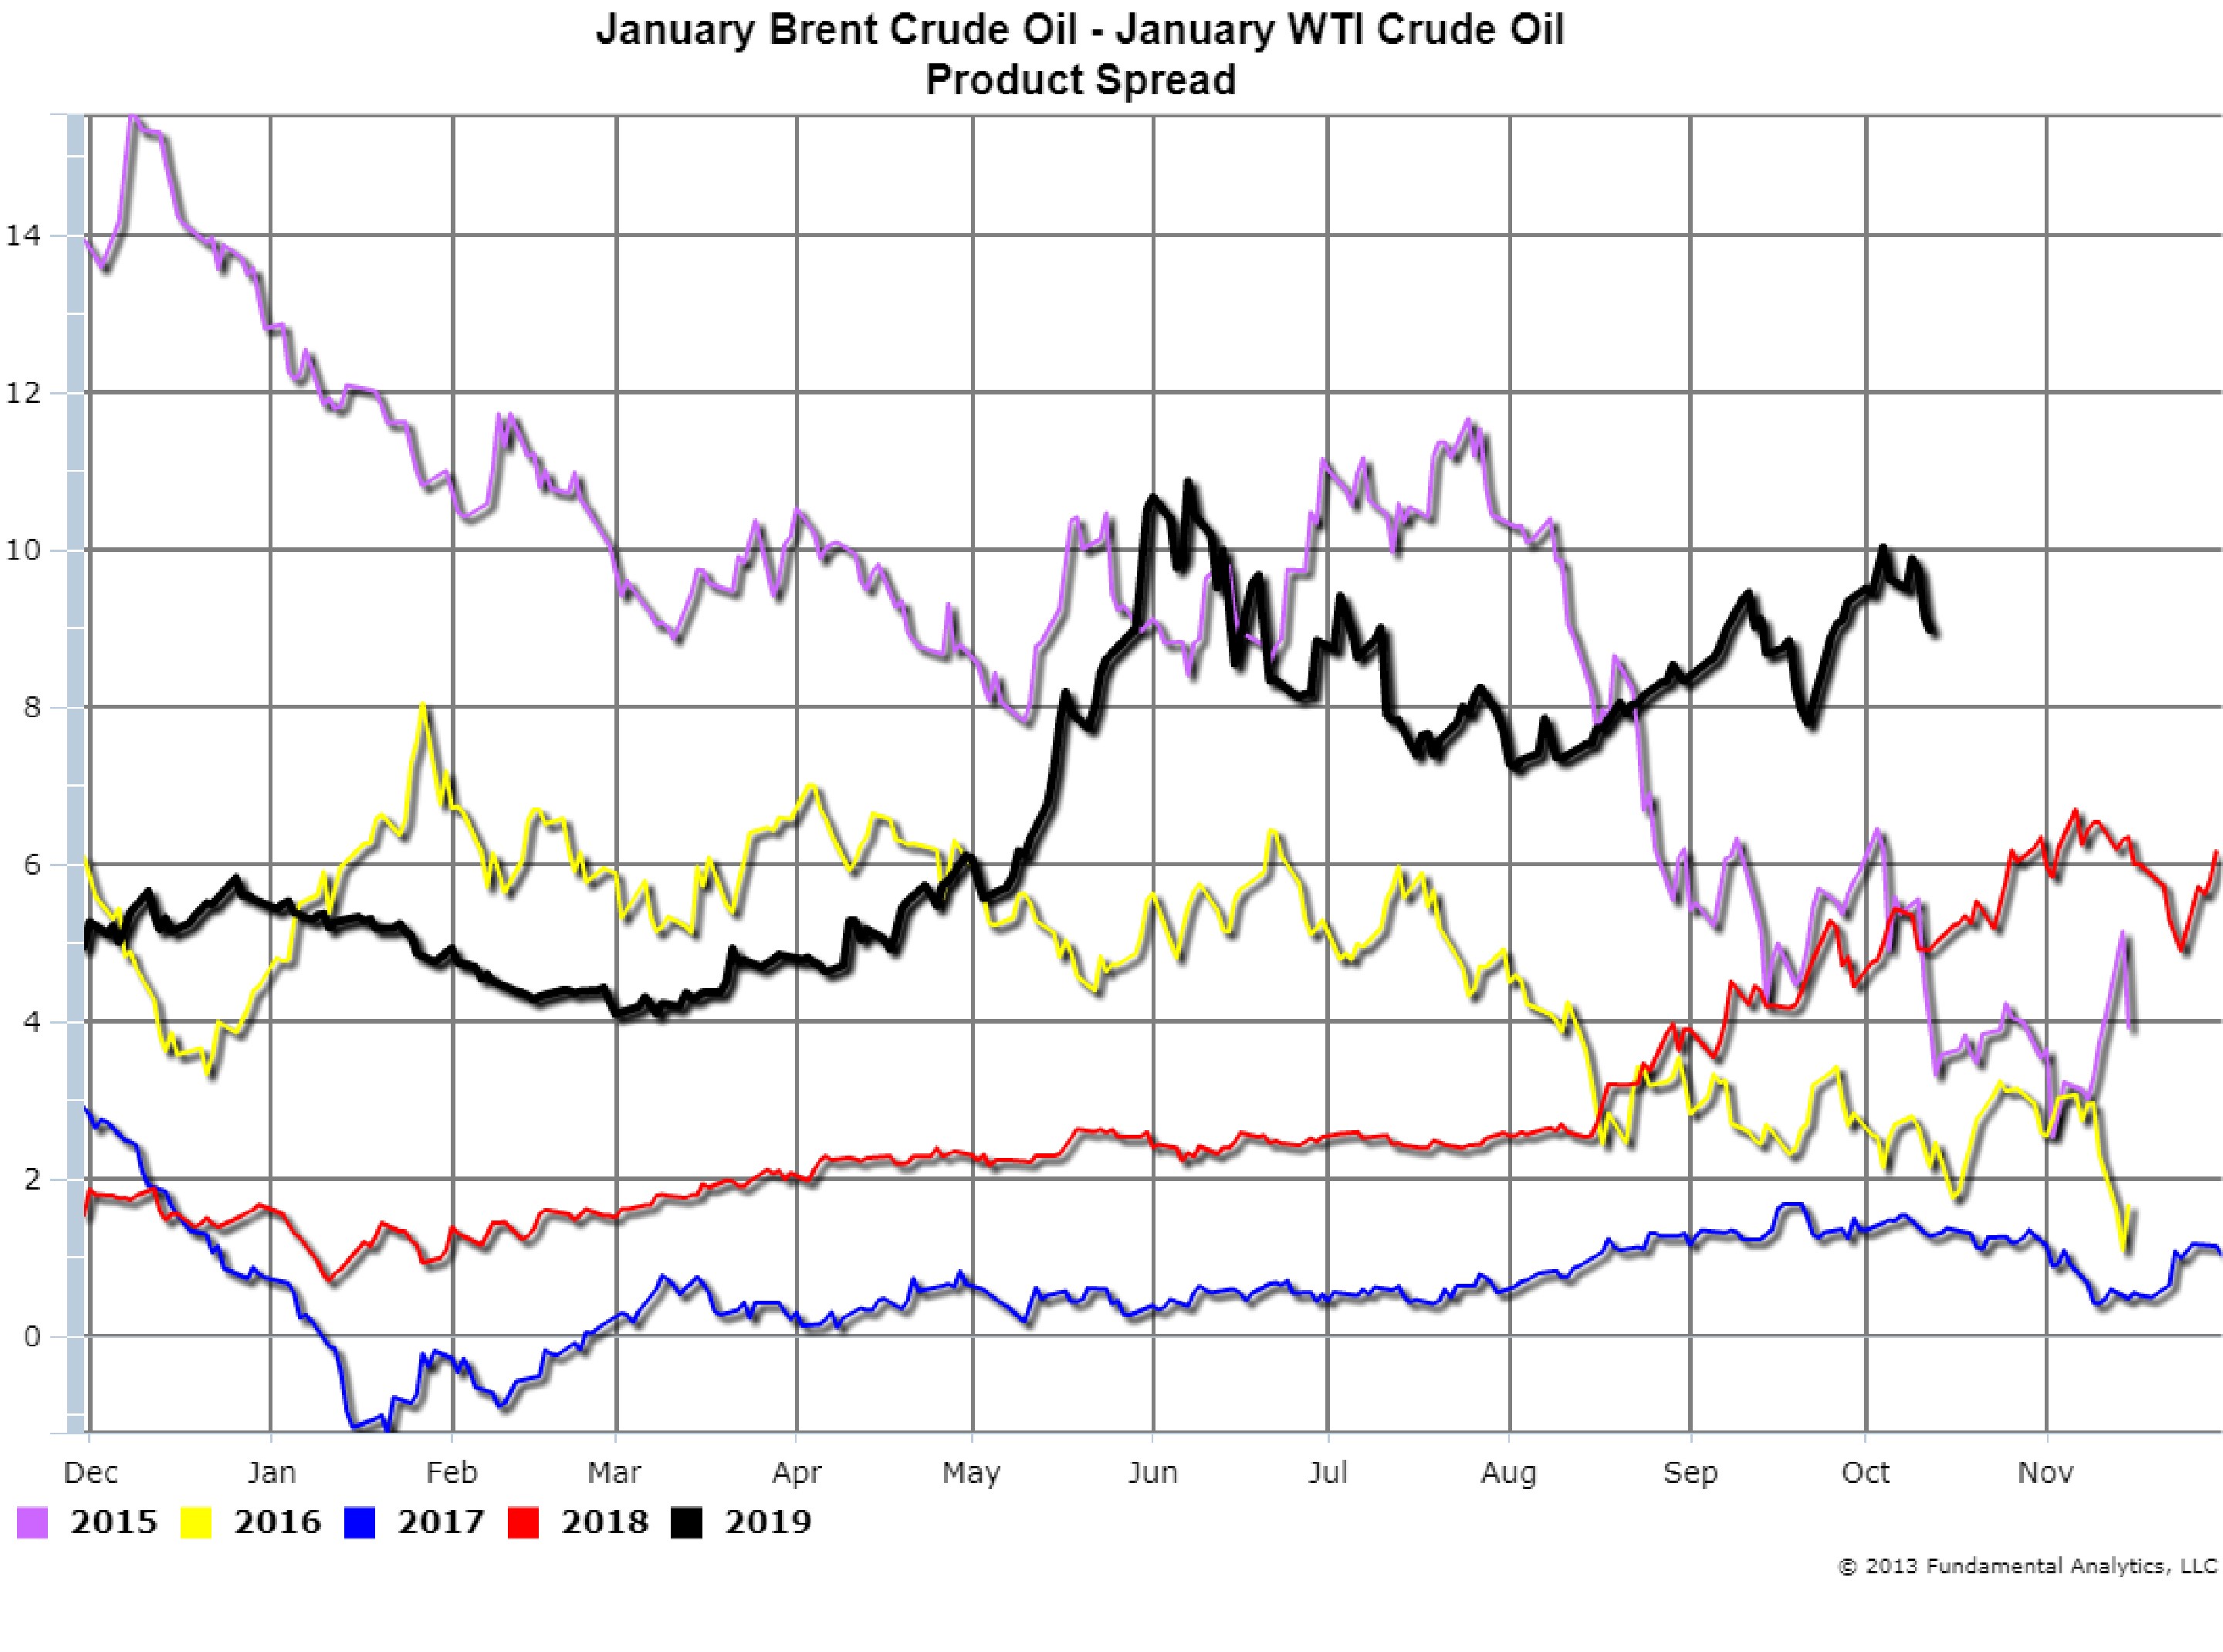
Crude oil prices have pulled back in the last several days as fears about declining oil consumption and the state of the world economy have replaced concerns over sanctions in Iran. As shown by the Brent Crude – WTI Crude Oil Product Spread (Chart 1, black line), since the beginning of October the January spread has dropped a dollar from $10. This drop is a result of the European benchmark, Brent Crude Oil, which has been trading significantly higher than the North American benchmark, WTI Crude OIL, decreasing faster than WTI.
Chart 1
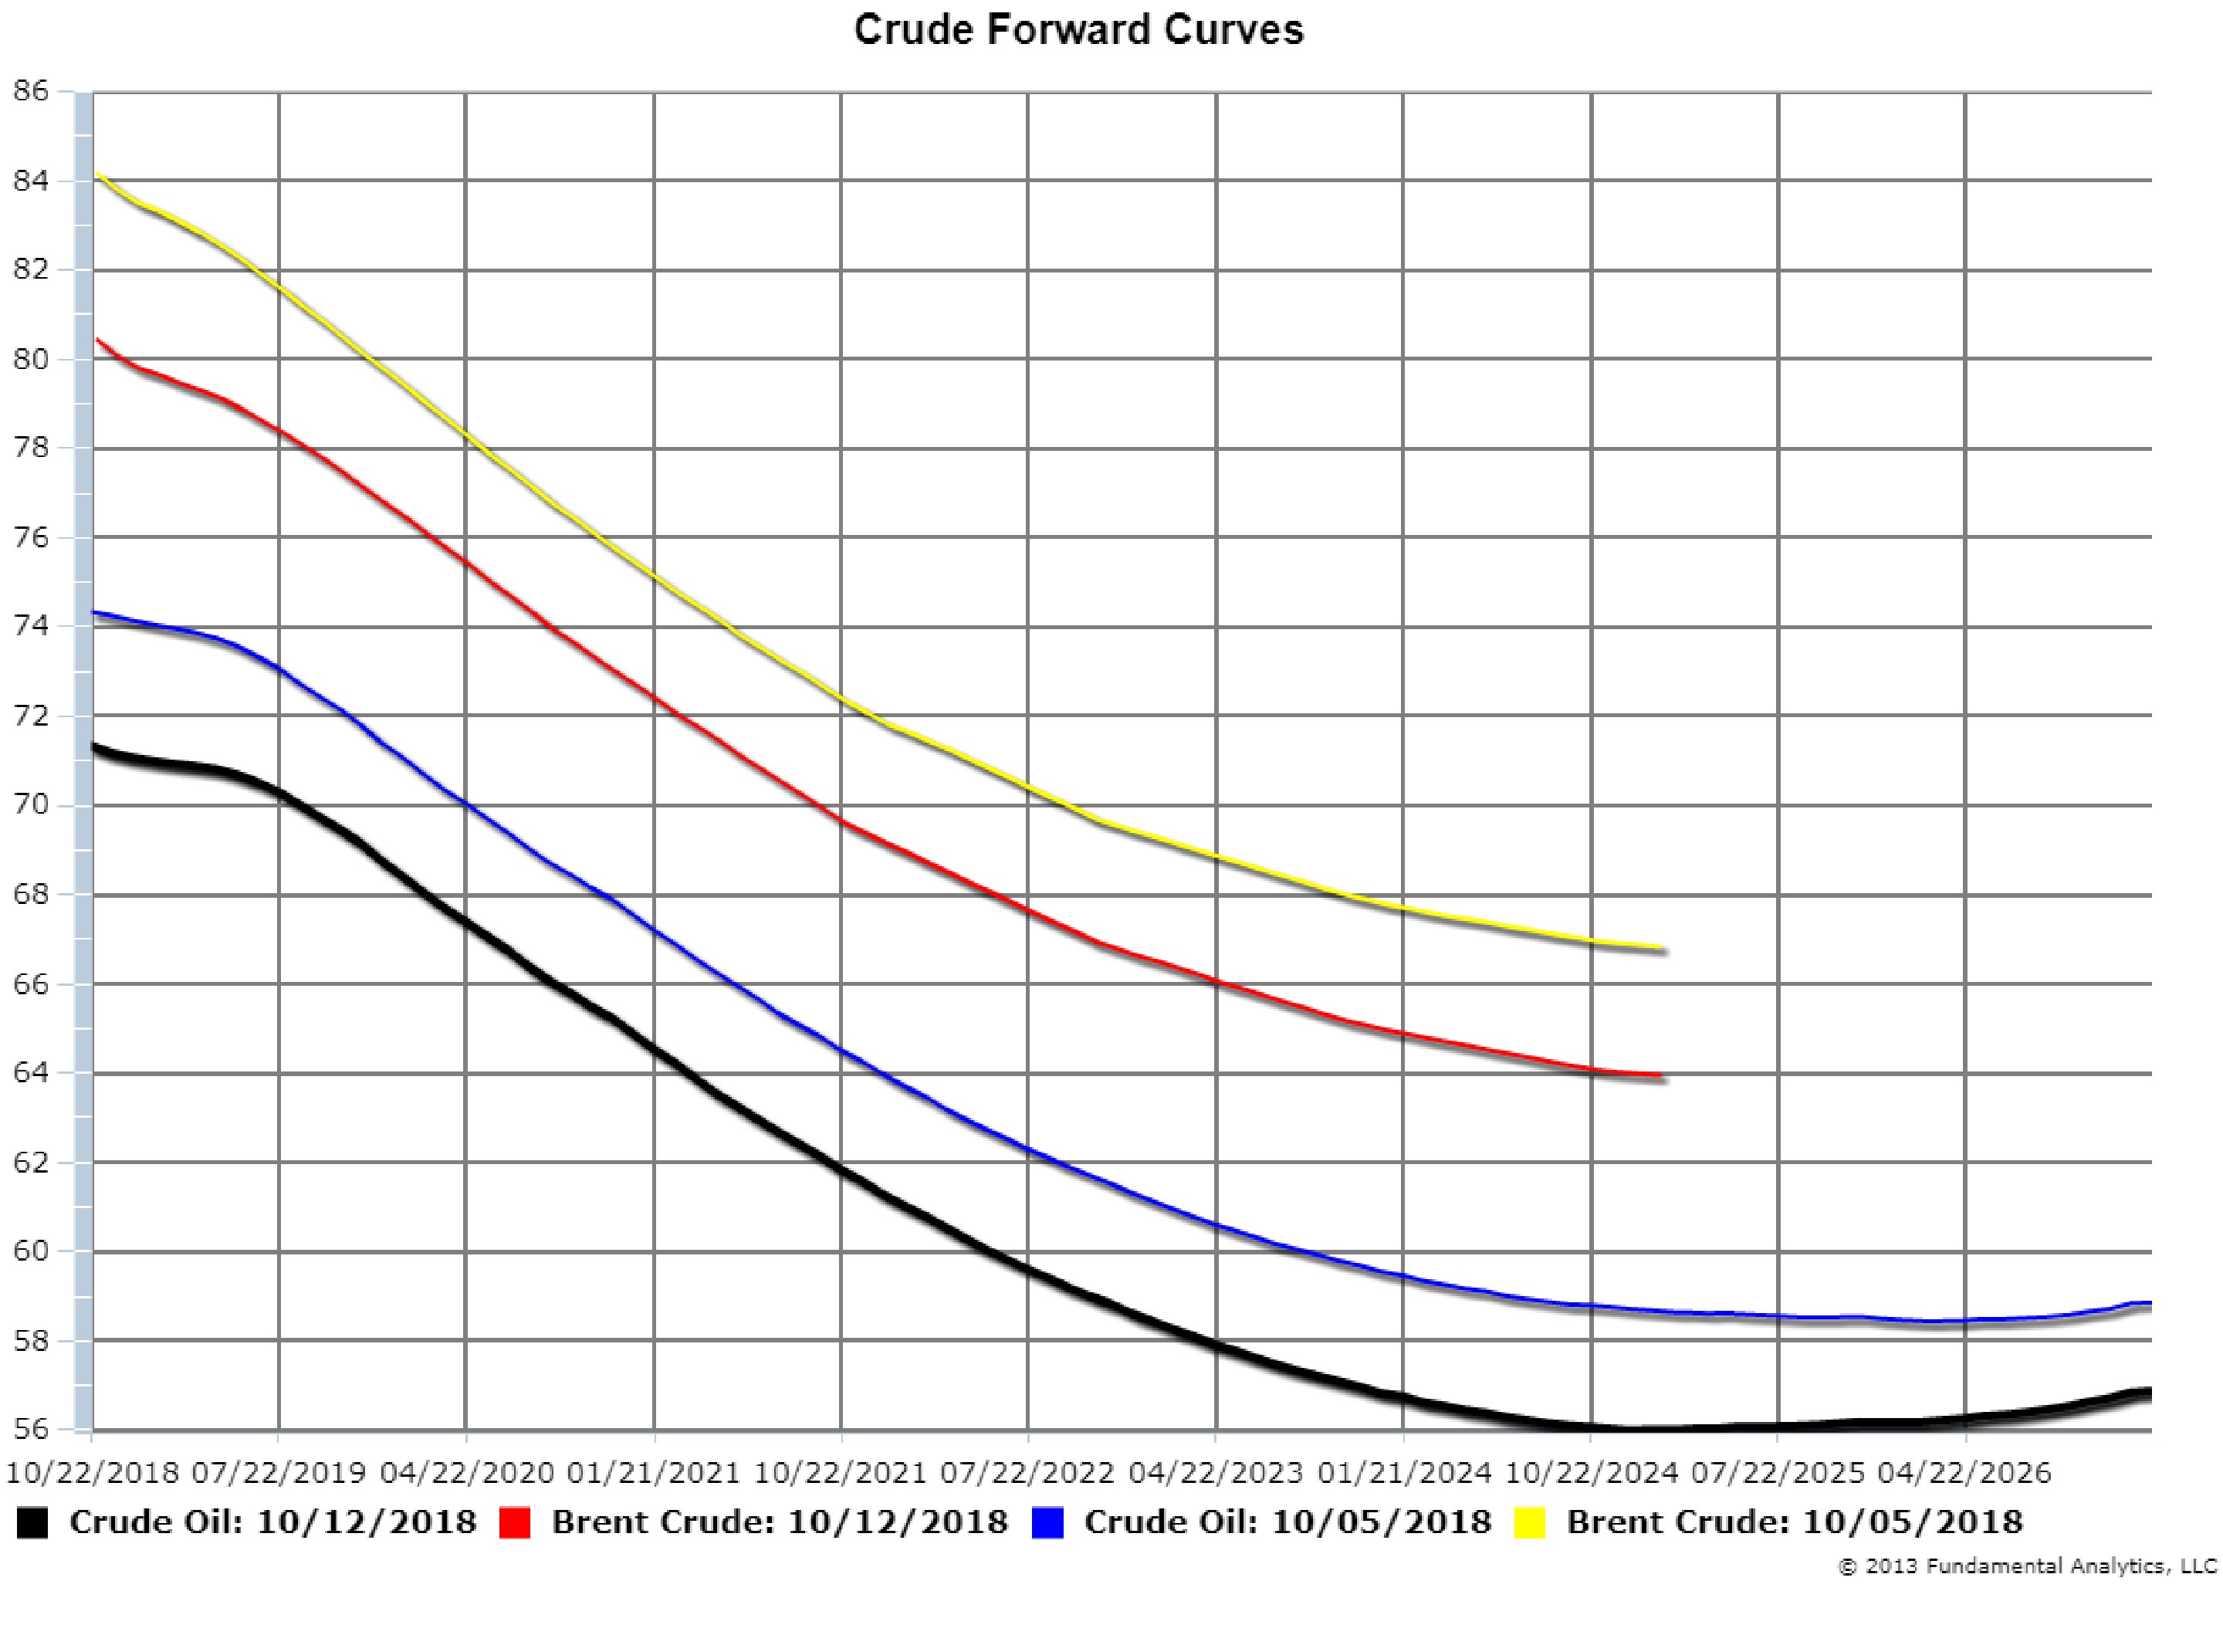
The drop in the Brent-WTI spread can illustrated by their respective forward curves. Chart 2 plots the forward curves of Brent and WTI as of October 5, 2018 and October 12, 2018. As of October 5, the Brent forward curve (yellow line) started at $84 and dropped to $80.50 (red line) by October 12, a $3.50 decrease. As of October 5, the WTI forward curve (blue line) started at $74 and dropped to $71.50 (black line) by October 12, a $2.50 decrease. Consequently, the net decrease of the Brent-WTI product spread was $1.
While the market sentiment has become bearish, currently it can change by just a news headline. Therefore, we recommend no trading positions in crude oil until the impact of the Iran sanctions are apparent and the change in OPEC and Russian crude oil supply are evident.
Chart 2
Grains
Corn
The latest WASDE report contained a bullish surprise for corn prices. Corn Ending Stocks were expected to be 1.919 billion bushels; instead, WASDE reported 1.813 billion bushels (Chart 1, 2018 bar). In addition rain and snow in the harvest region are delaying the harvest, so corn prices have risen 22 cents, 6%, since mid-September (Chart 4). This bull run in prices appears to be continuing so we recommend consideration of long positions in the outrights or calendar spreads.
Chart 3
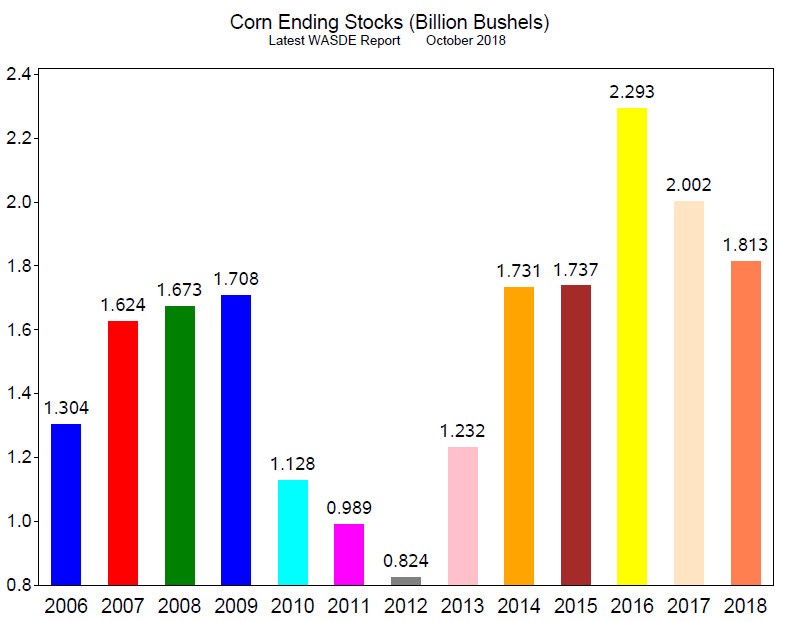
Chart 4

Soybeans
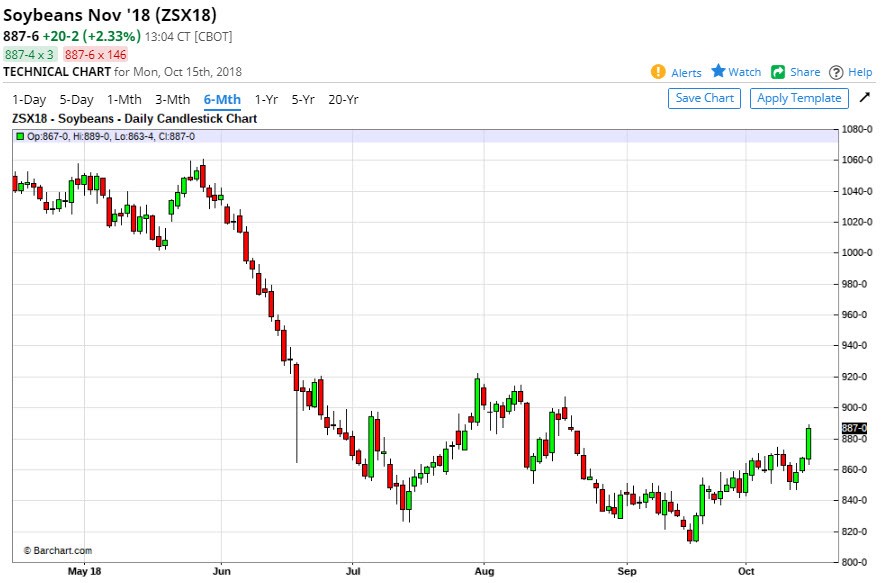
Similarly, the latest WASDE report contained bullish data for soybean prices. Soybeans Ending Stocks were expected to be 898 million bushels; instead, WASDE reported 885 million bushels (Chart 5, 2018 bar). And with rain and snow in the harvest region delaying the harvest, soybean prices have risen 61.5 cents, 7%, since mid-September (Chart 6). While this bull run in prices has been impressive we are concerned about the record Ending Stocks so we recommend cautious consideration of long positions in the outrights or calendar spreads.
Chart 5
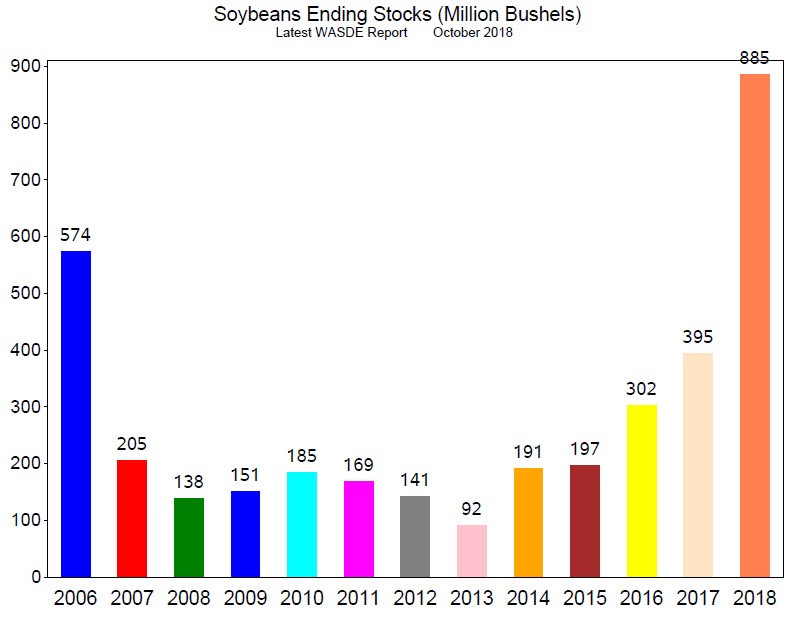
Chart 6
For more information reach out to joel.fingerman@fundamentalanalytics.com