Energy
Crude Oil prices have dropped since the beginning of October because of the market’s expectation that Saudi Arabia will make up for lost supply from Iran and slowing world demand growth for crude oil. For example, the January Crude Oil contract price has decreased $7.25 from October 1 to October 26 (Chart 1, black line).
Chart 1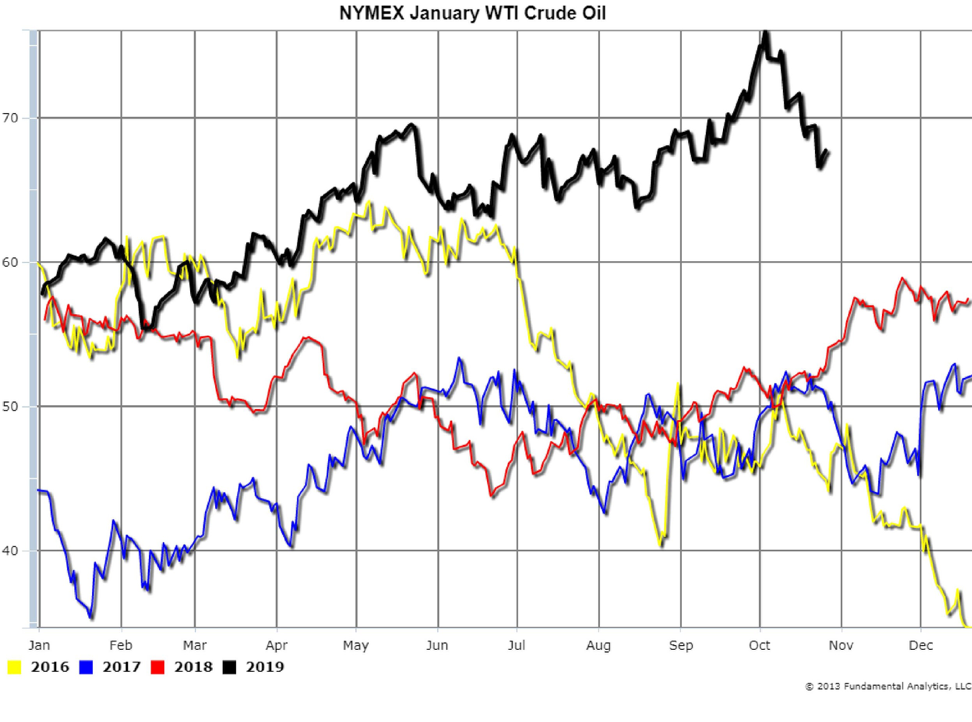
Products refined from Crude Oil have dropped in price in tandem with Crude Oil prices. For example, the January RBOB Gasoline contract price decreased by over 30 cents per gallon (or $13.00 per barrel) from October 1 to October 26 (Chart 2, black line). This means that the finished product, Gasoline, dropped in price greater than the underlying raw material price, Crude Oil.
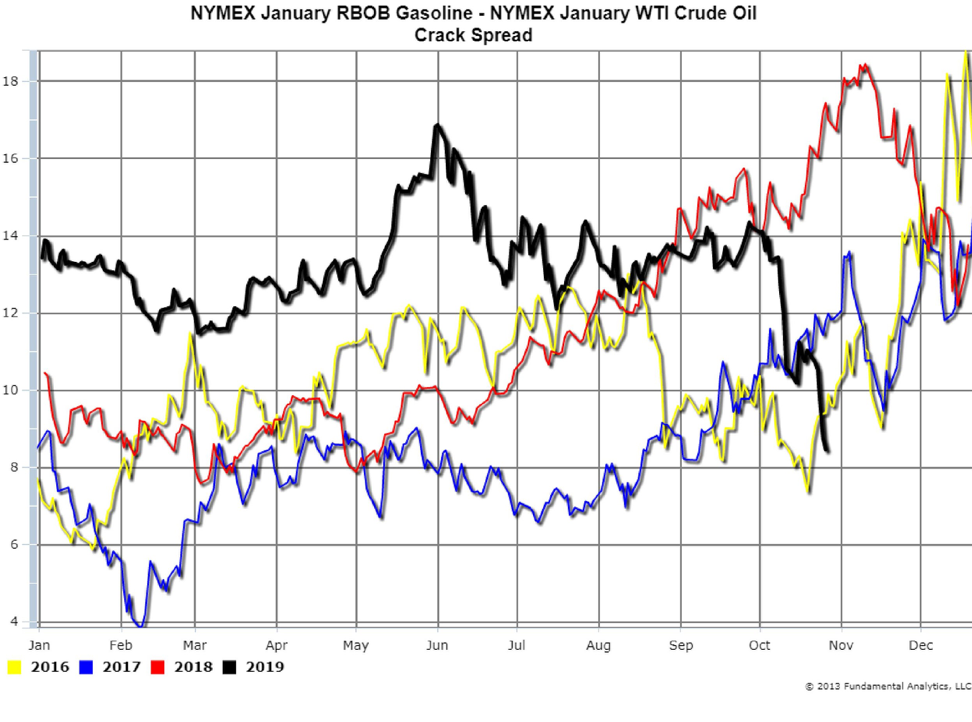
Thus the spread between January Gasoline and January Crude Oil (the Crack Spread) reduced by $5.75 (Chart 3, black line). This Crack Spread drop is understandable as the summer Gasoline driving season has ended and demand is decreasing.
Chart 2
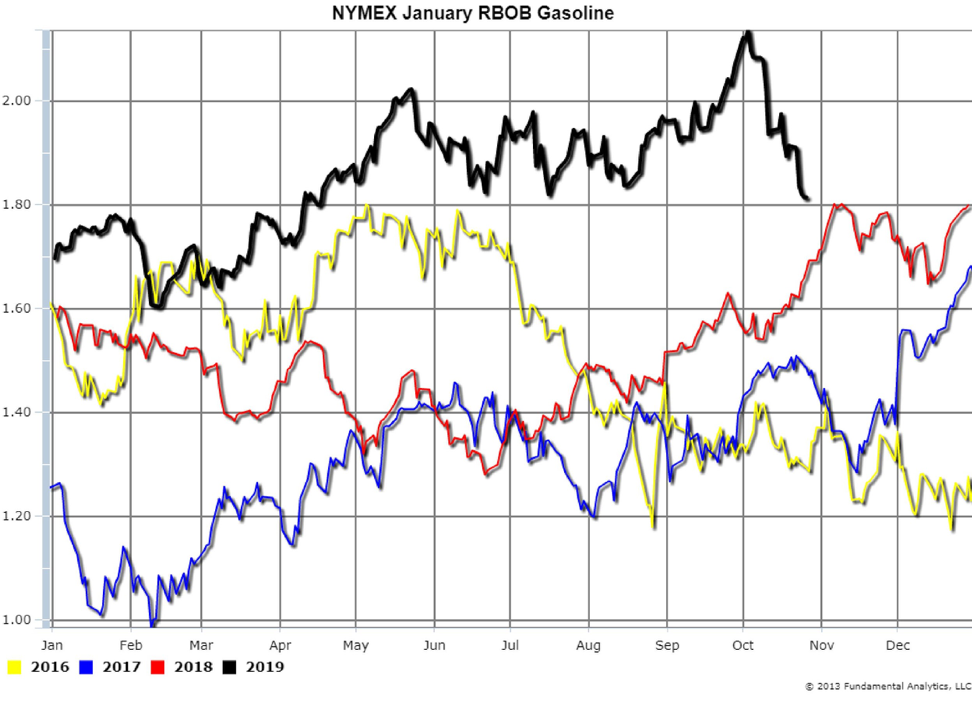
Chart 3
In comparison, the January Heating Oil contract price decreased by only 11 cents per gallon (or $4.62 per barrel) from October 1 to October 26 (Chart 4, black line). Heating Oil dropped in price less than Crude Oil so the Heating Oil Crack spread widened by over $2.50 (Chart 5, black line). This Crack Spread increase is reasonable in that Winter Heating season has begun and demand for Distillates is at record levels for this time of the year.
Consequently, we recommend consideration of being short Gasoline to Crude spreads and being long Heating Oil to Crude spreads.
Chart 4
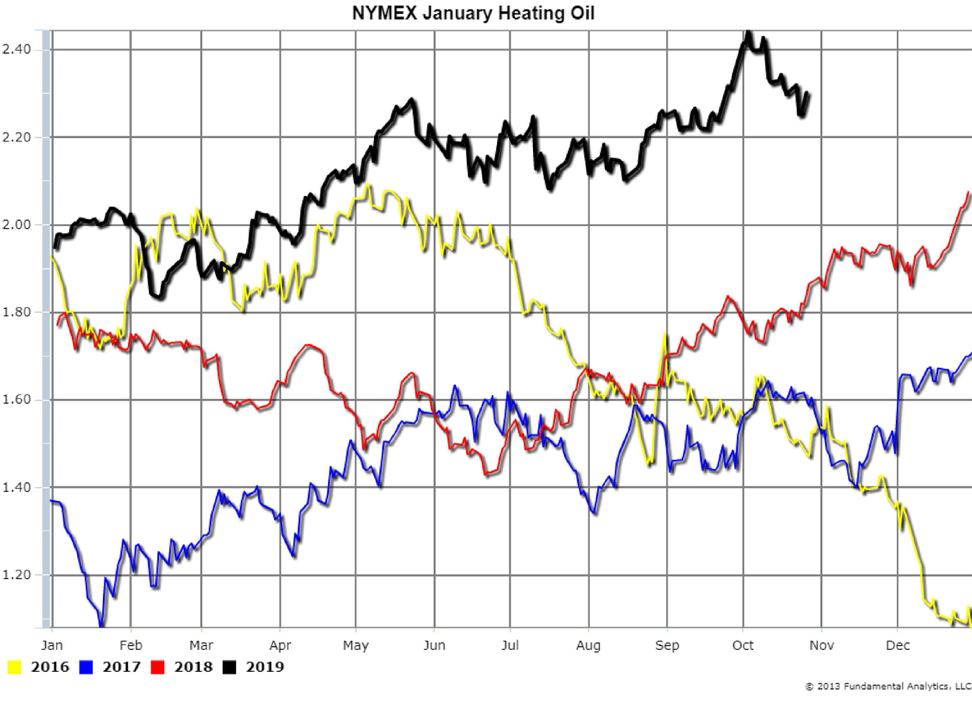
Chart 5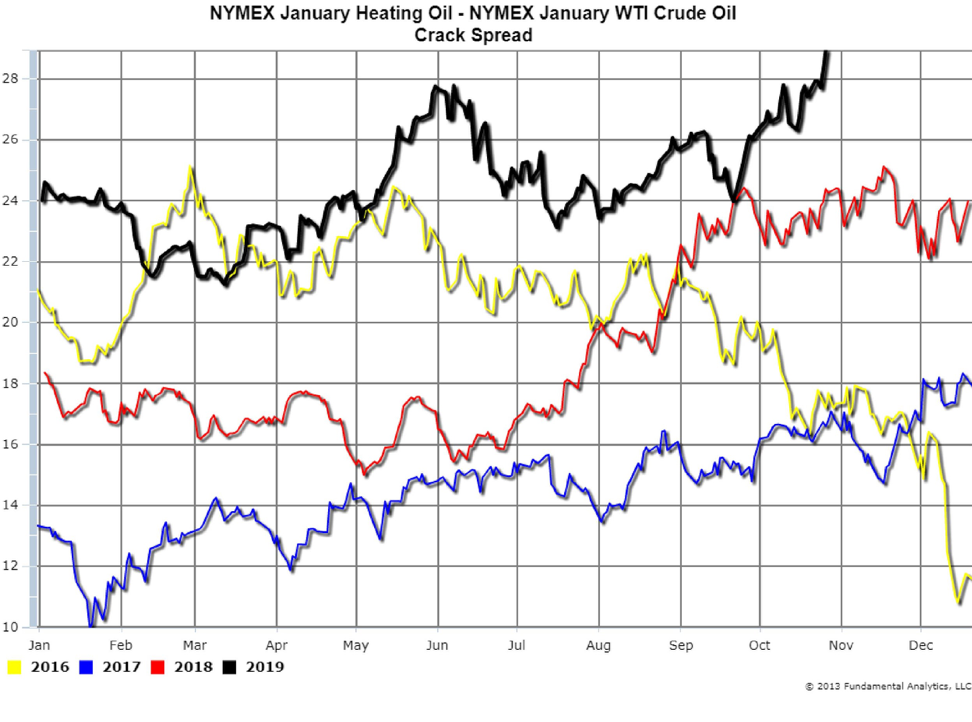
Grains
Soybeans
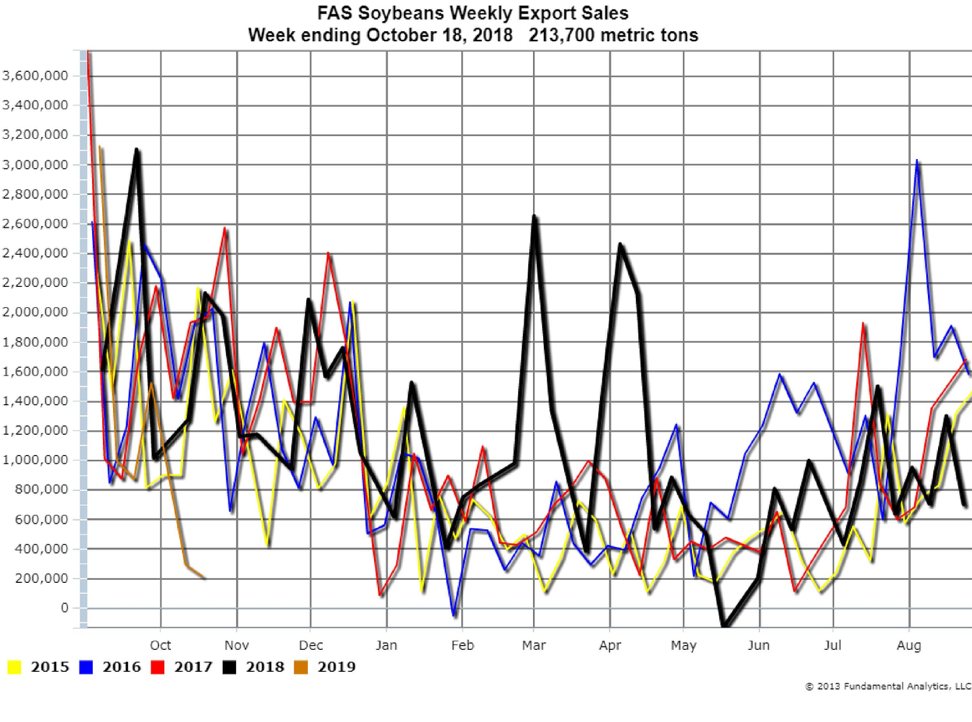
Fundamentals continue to be bearish to price with another low FAS export sales report for the 2018-2019 market season. Weekly Export Sales for the week ending October 18 reported soybeans exports at 213,700 ton (Chart 6, orange line). The sales number was below expectations of 300,000 – 700,000 metric tons.
Chart 6
Corn
Weekly Export Sales for the week ending October 18 reported corn exports at 377,500 metric tons (Chart 7, orange line). The sales number was below expectations of 400,000 – 800,000 metric tons.
Soybeans and Corn prices dropped sharply on the poor weekly export sales. Large harvest advancements and a stronger dollar are adding to the downward seasonal pressure on prices. Producers are storing much of the crop as they are not willing to sell at current low prices. With these pressures on prices we suggest consideration of short positions in both soybeans and corn.
Chart 7
