Energy
It appears that Hurricane Florence has had no appreciable impact on energy prices or price volatility. Prices have been range bound and volatility is low. Chart 1 below plots December Crude Oil Volatility as measured by the options At-the-Money Implied Volatility. The December 2018 Crude Oil Volatility (black line) has been range bound between 23% and 27% volatility.
The low crude oil volatility is a reflection of the steady cash and futures gasoline prices in the East Coast despite Hurricane Florence. Large gasoline inventories in the East Coast (Chart 2, black line) have kept prices steady even with some temporary refinery shutdowns. East Coast gasoline inventories as of September 7, 2018 were at 66.75 million barrels, the highest level for September, according to the DOE.
Chart 1
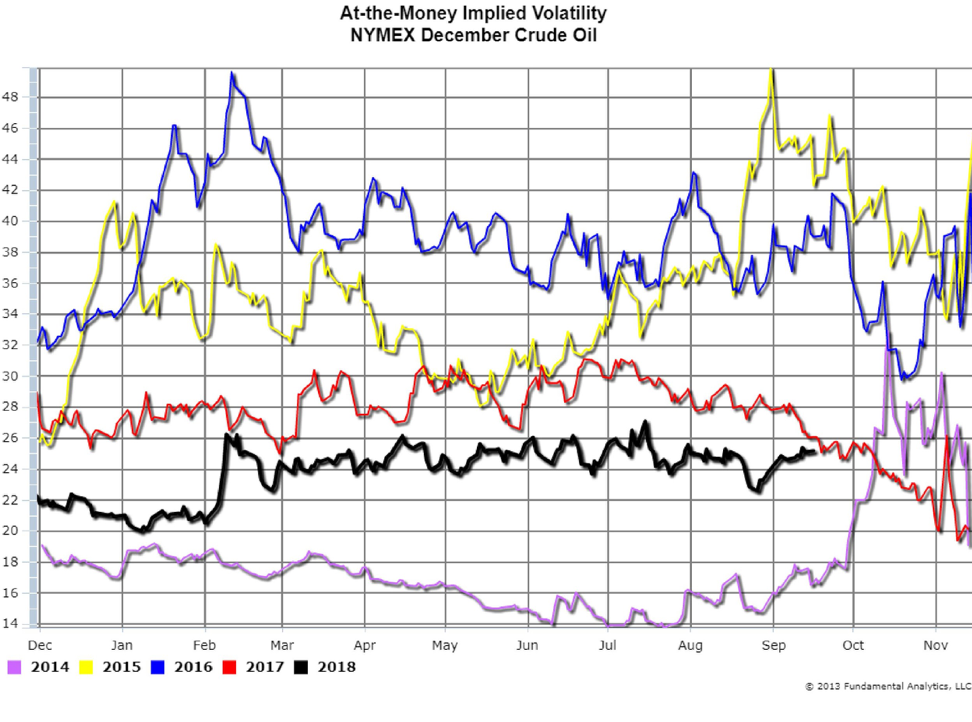
Chart 2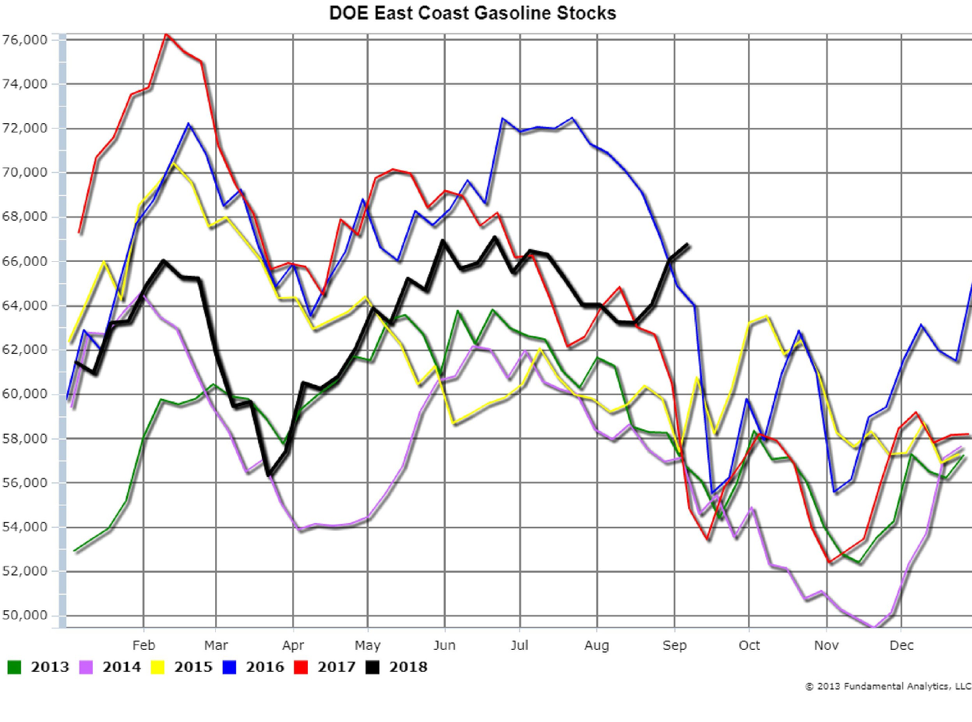
Grains
USDA WASDE (World Agriculture Data Estimates) report was released September 12, 2018 with unexpected data that are bearish to price.
The expectation for US Corn Yield was 177.8 bushels per acre, and WASDE reported 181.3 bushels per acre (Chart 3, 2018). Expectations for the US Ending Corn Stocks was for 1.639 billion bushels, and WASDE reported 1.774 billion bushels (Chart 4, 2018). Corn prices have dropped 4.5 cents per since the release of the report.
Chart 3
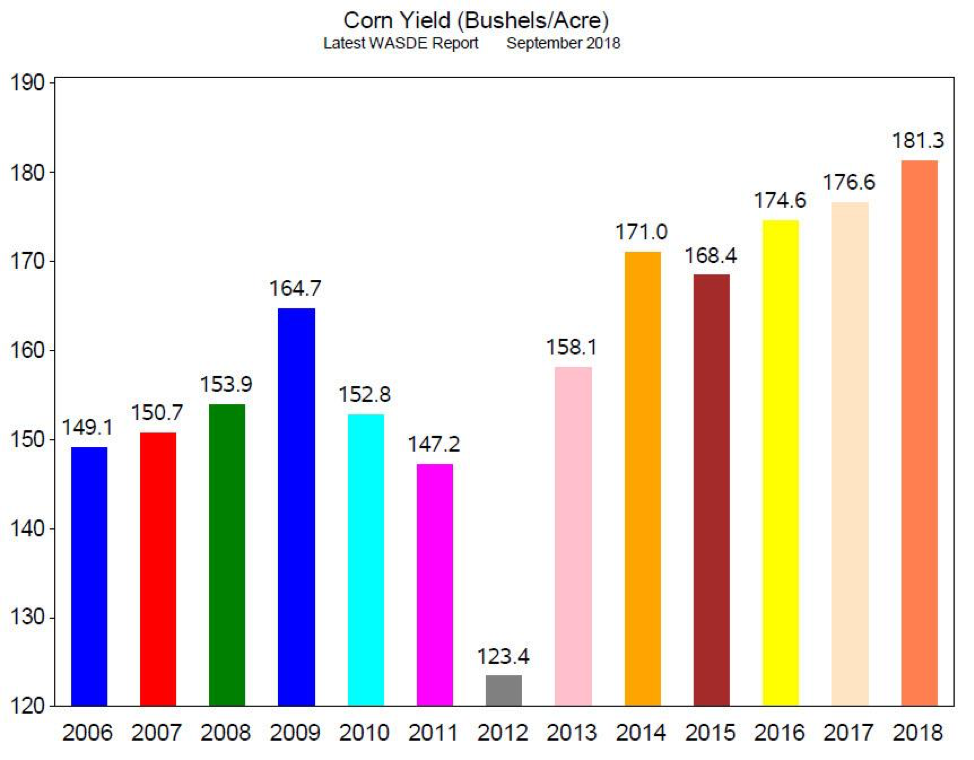
Chart 4
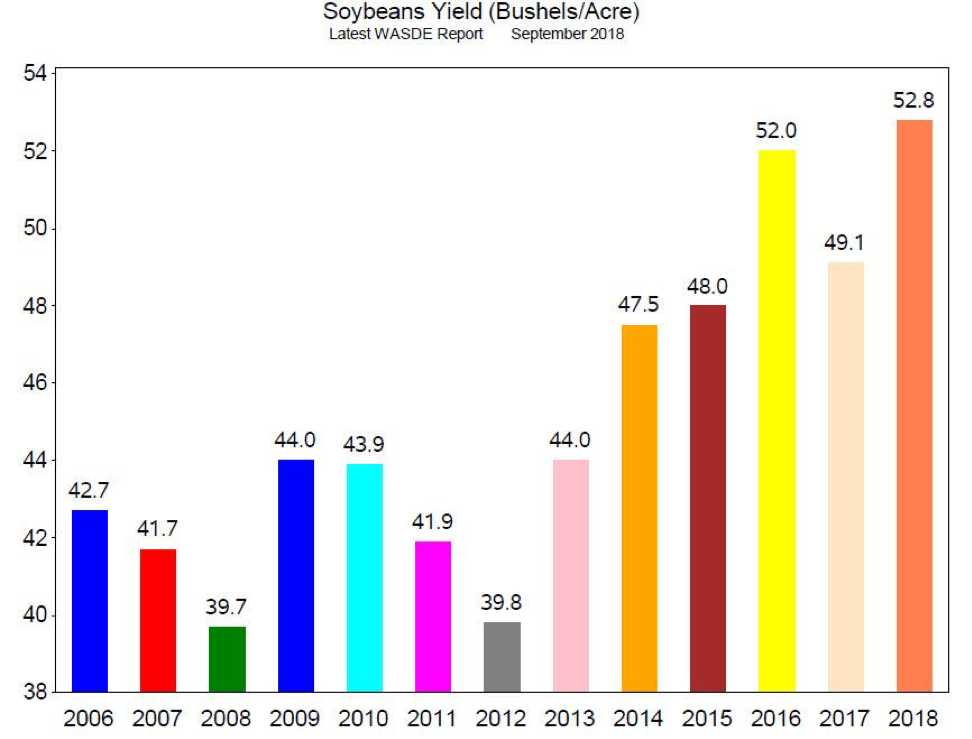
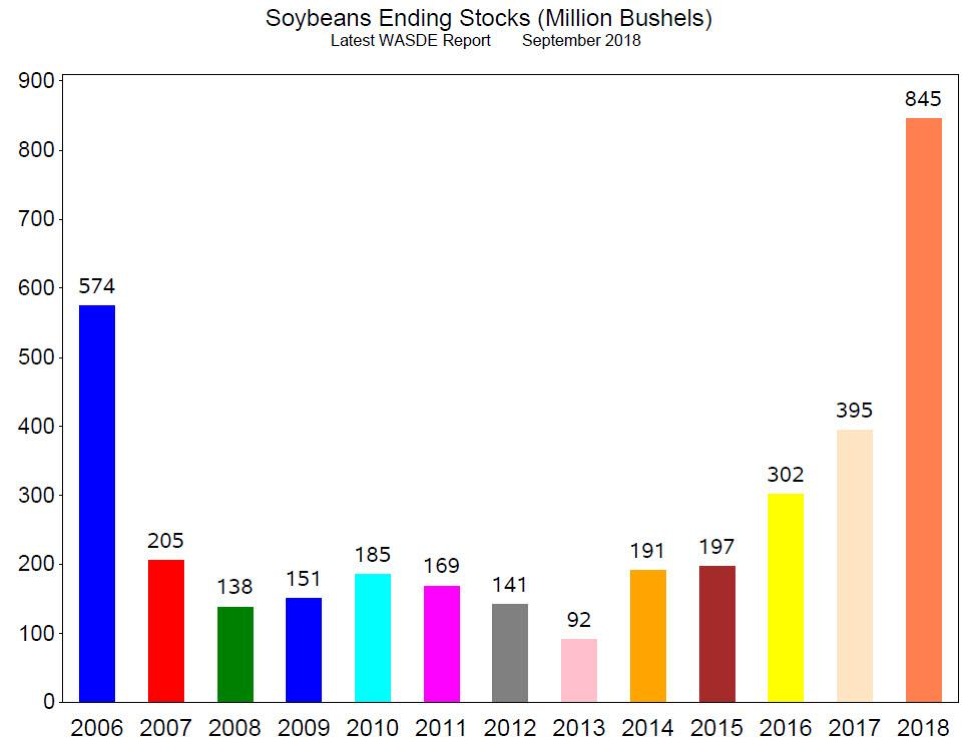
Analysts expected US Soybeans Yield at a record 52.2 bushels per acre and the WASDE report was even greater at 52.8 bushels per acre (Chart 5, 2018). US Ending Corn Stocks were also expected at a record 830 million bushels, yet the WASDE report was even greater at 845 million bushels (Chart 6,2018). Soybeans prices have since dropped 9.5 cents per bushel.
Chart 5