DOE Insights August 15, 2018
Crude Oil
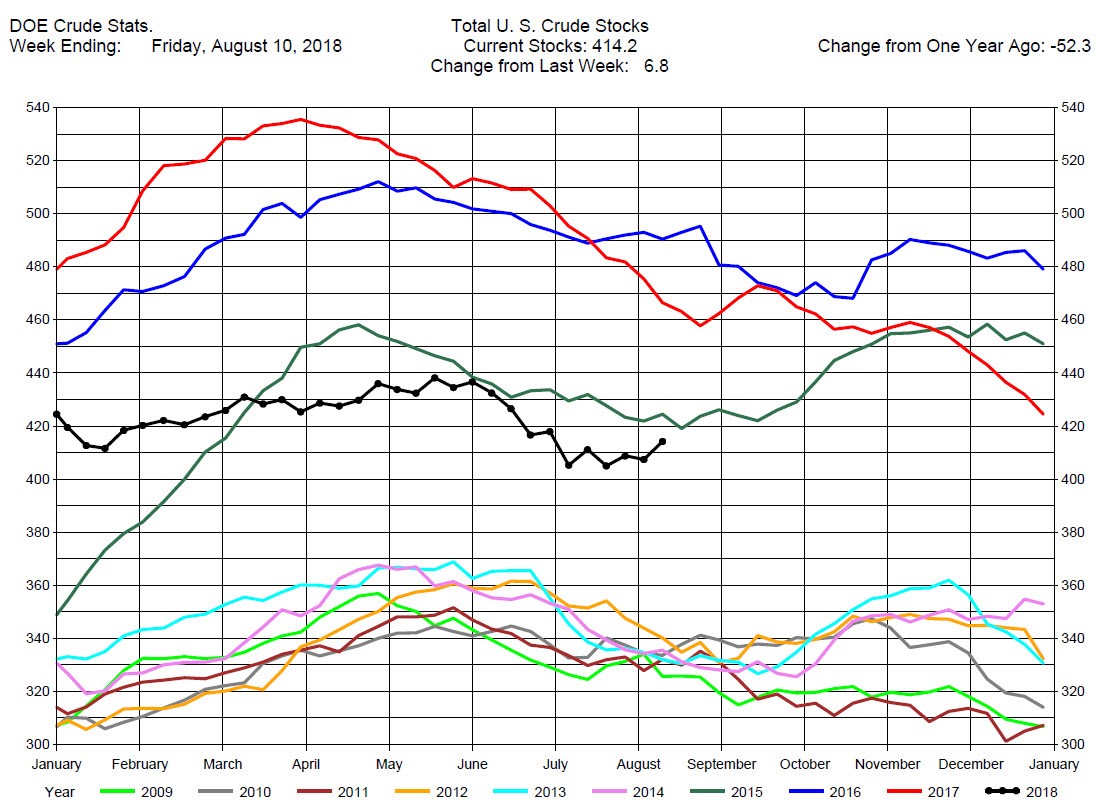
Stocks Large Build, Expectations were for a Draw.
The DOE reported Total Crude Oil Inventories increased by 6.8 million barrels to 414.2 million barrels for the week ending August 10, 2018, while expectations average was for a 2.6 million barrel decrease.
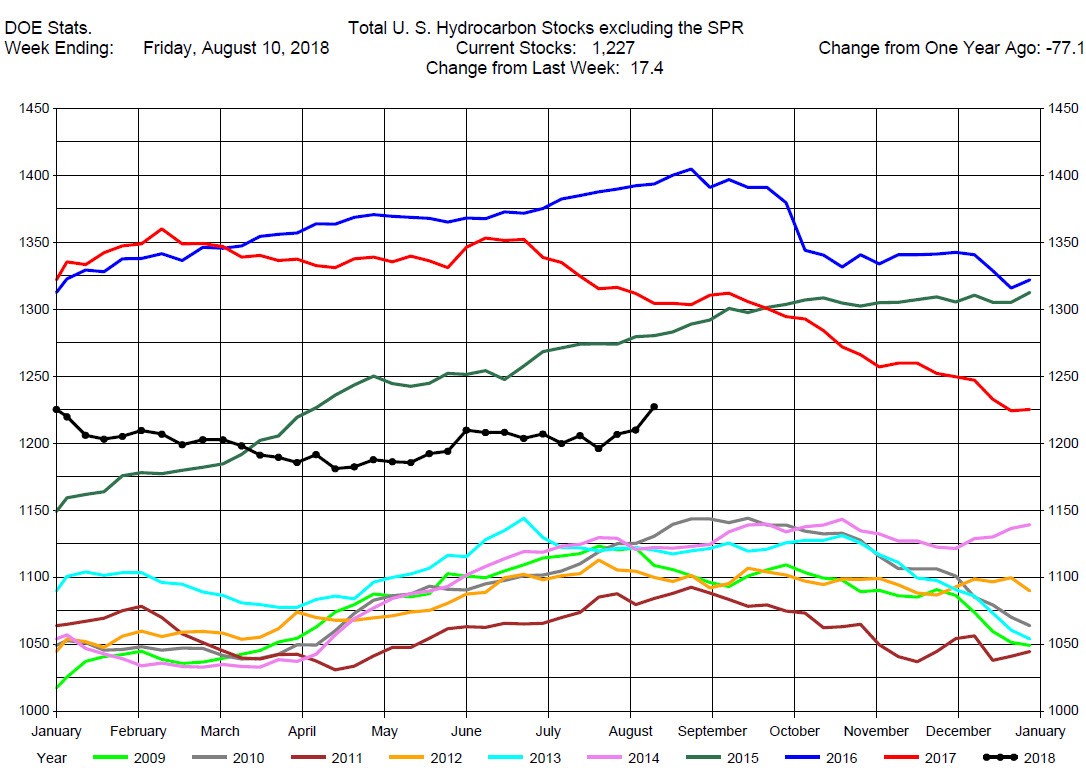
Overall hydrocarbon supplies increased by 17.4 million barrels to 1,227 million barrels.
Crude Oil Production was up slightly by 100,000 barrels per day to 10.9 million barrels per day.
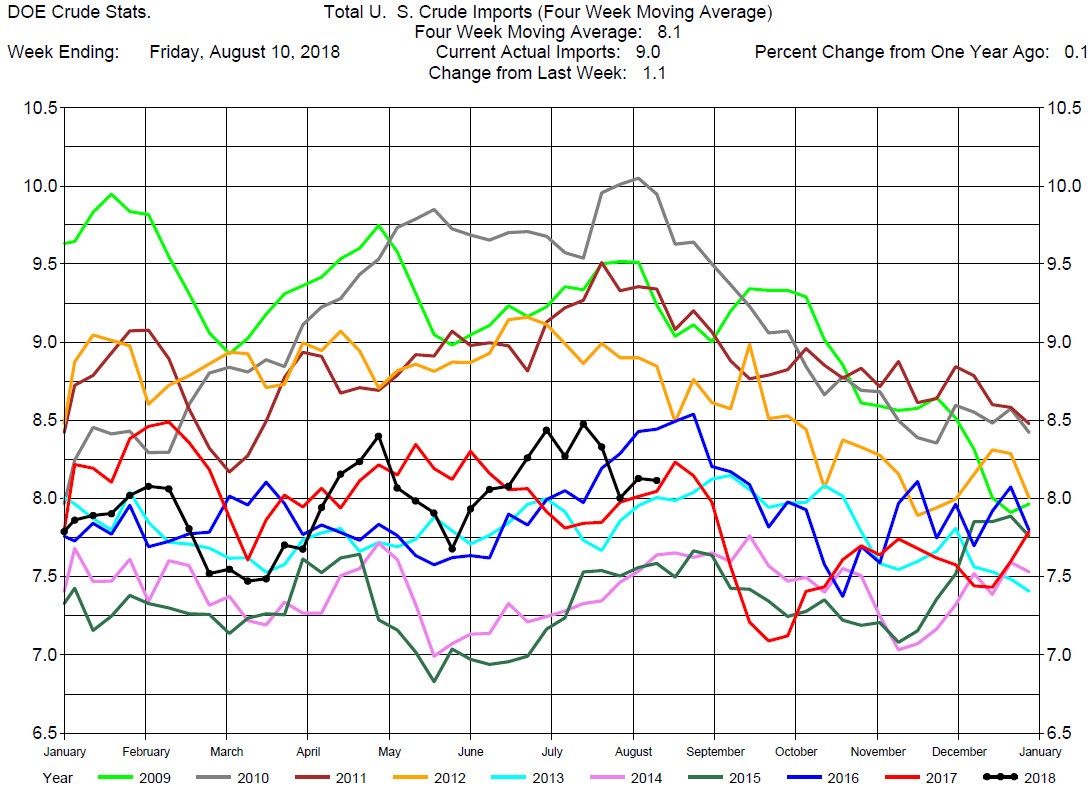
Total Crude Imports were up 1.1 million barrels per day to 9.0 million barrels per day.
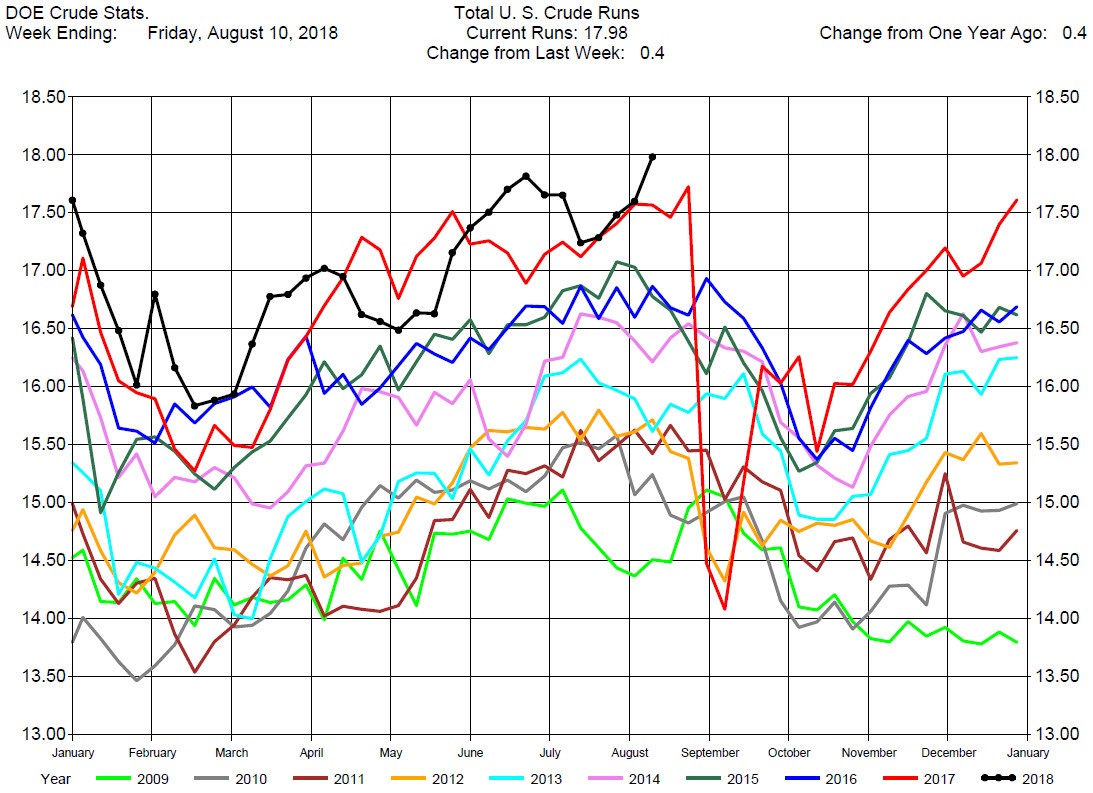
Total Refinery Crude Runs were up 400,000 barrels per day to 17.98 million barrels per day.
As with last week, the Crude Oil Stocks report was puzzling. Crude Oil Production was 10.90 million barrels per day, Imports were 9.00 million barrels per day, and Exports were 1.59 million barrels per day, so the net Crude Oil supply was 10.90 + 9.00 – 1.59 = 18.31 million barrels per day. Crude Runs (demand) were 17.98 million barrels per day so the implied net build was 18.31 – 17.98 = .33 million barrels per day, or a 2.31 million barrels increase for the week. The DOE reported 6.8 million barrel increase. Regardless of the discrepancy, the DOE report was bearish to prices.
Prices dropped 75 cents with the release of the report, and traded lower throughout the day, ending down around $2.00.
There are currently competing arguments regarding global crude oil supply and demand. The bearish view is that rising production from Saudi Arabia, Kuwait, the United Arab Emirates, and Russia has eased concerns regarding sufficient crude supply. Also, some analysts believe the slowing rate of growth in crude demand, especially from China, will contribute to crude oversupply and thus lower prices. The bullish view is that when the upcoming US sanctions on Iran occur as much as 2 million barrels per day of crude oil supply will leave the market. The bullish argument also views OPEC spare capacity as too low to make up for lost Iranian supply. An example of the bullish price opinion is Pierre Andurand, who runs the $1.5 billion Andurand Commodities Fund, and believes crude oil prices could rise to $150 in two years
We maintain our suggestion to not take trade positions in the near term and wait until a confirmed price direction is established.
Gasoline
Stocks Draw. Greater than Expectations.
Total MotorGasoline Inventories decreased by 700,000 barrels to 233.1 million barrels for the week ending August 10, 2018, while expectations average was for a 500,000 barrel decrease.
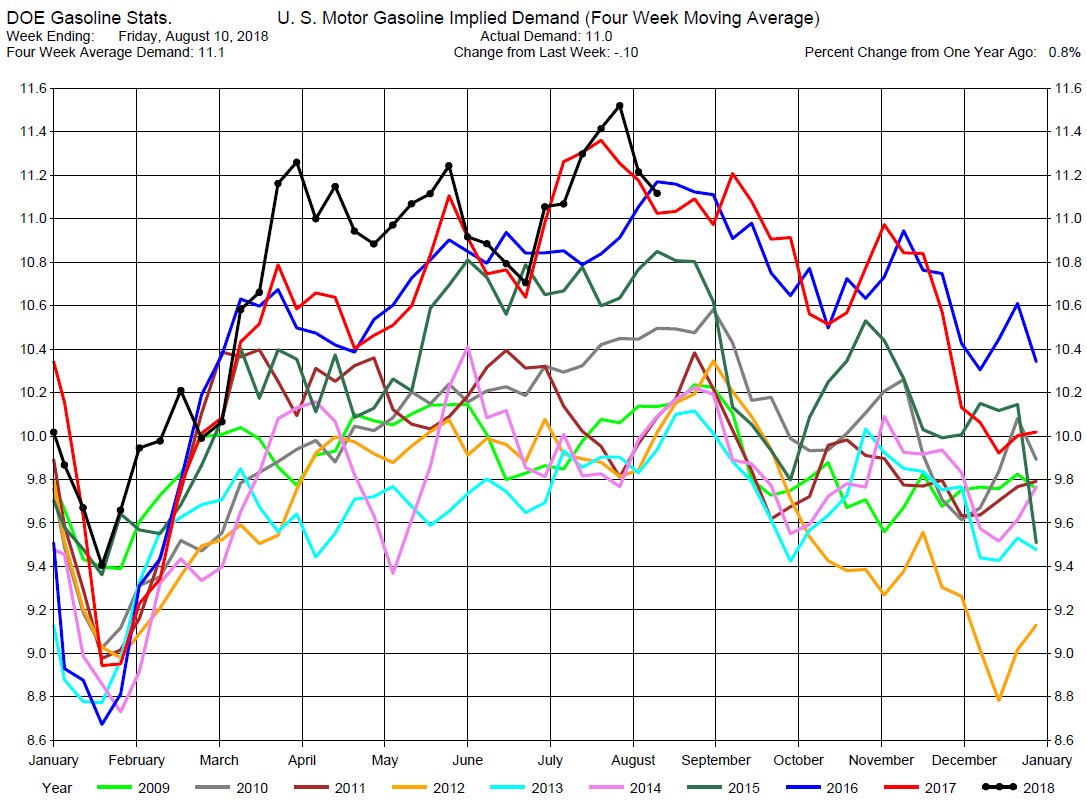
Implied Demand was off by 100,000 barrels per day to 11.10 million barrels per day.
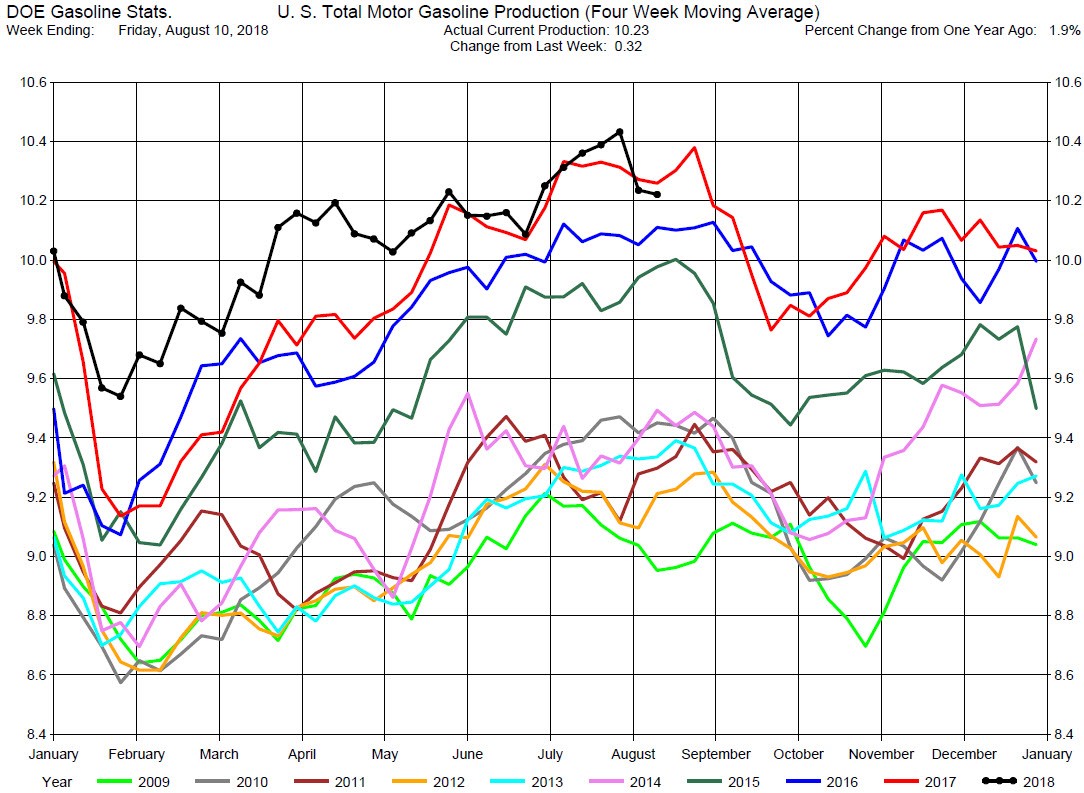
Gasoline Production was up 320,000 barrels per day to 10.23 million barrels per day.
The choppy behavior of crude oil prices has increased the volatility in the gasoline crack spreads and calendar spreads. So while we still suggest considering long positions in the cracks or calendar spreads, this may be a time to wait for a confirmed price direction in crude oil.
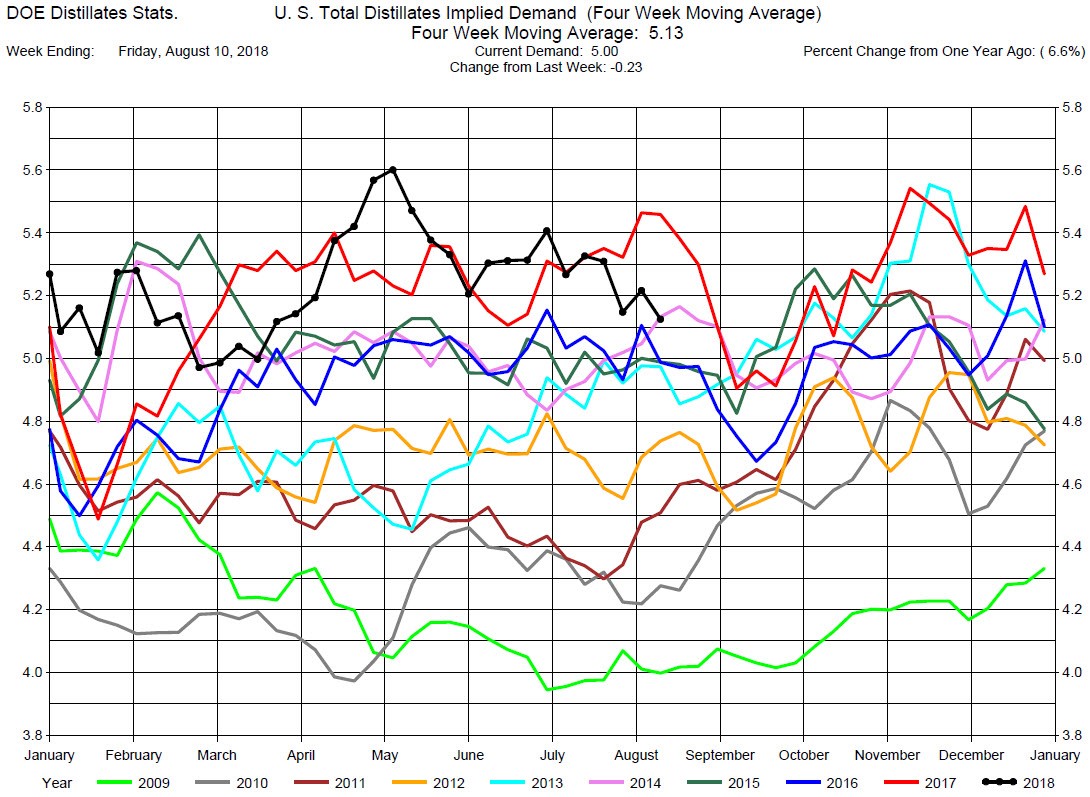
Distillates
Stocks Build, Greater than Expectations
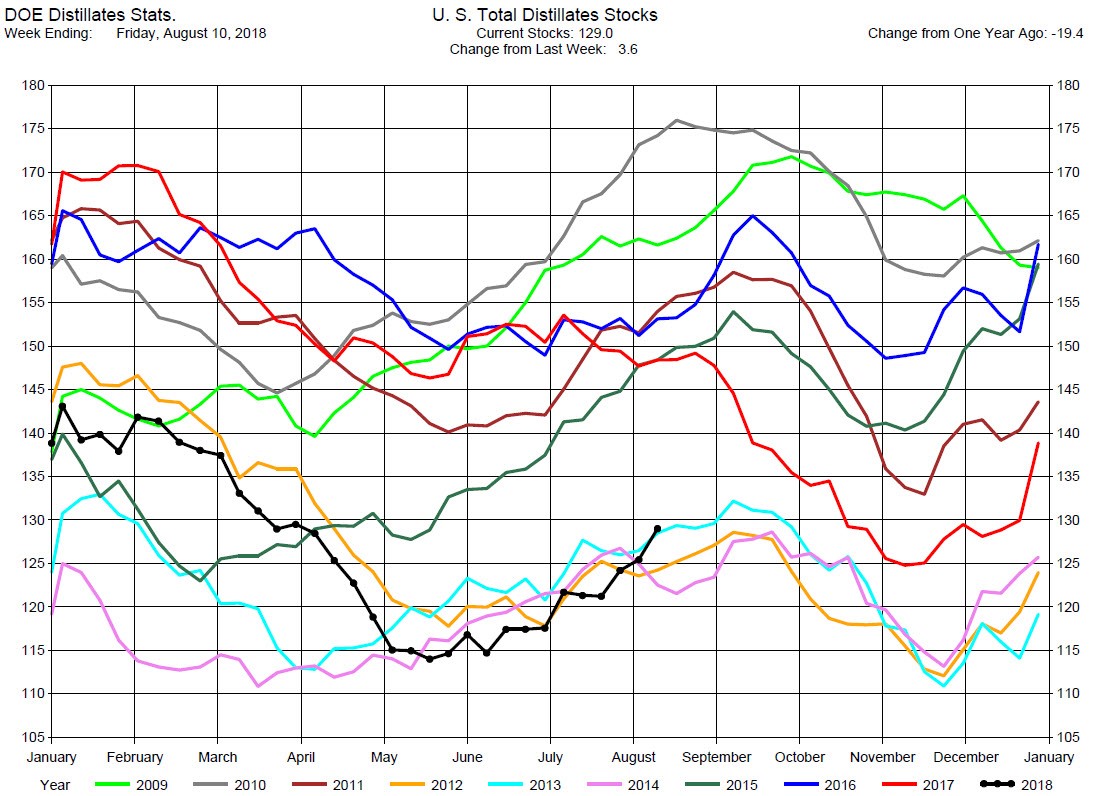
Total Distillates Stocks increased by 3.6 million barrels to 129.0 million barrels for the week ending August 10, 2018, while expectations average was for a 700,000 barrel build.
Total Distillates Production was up 100,000 barrels per day to 5.34 million barrels per day.
Total Distillates Implied Demand decreased by 230,000 barrels per day to 5.0 million barrels per day.
The choppy behavior of crude oil prices has also increased the volatility in the heating oil crack spreads and calendar spreads. As with gasoline we still suggest considering long positions in the heating oil cracks or calendar spreads, this may be a time to wait for a confirmed price direction in crude oil.

For further information contact joel.fingerman@fundamentalanalytics.com