Commodity Market Update November 14, 2018
Energy
Crude Oil and Natural Gas: A Study in Contrasts
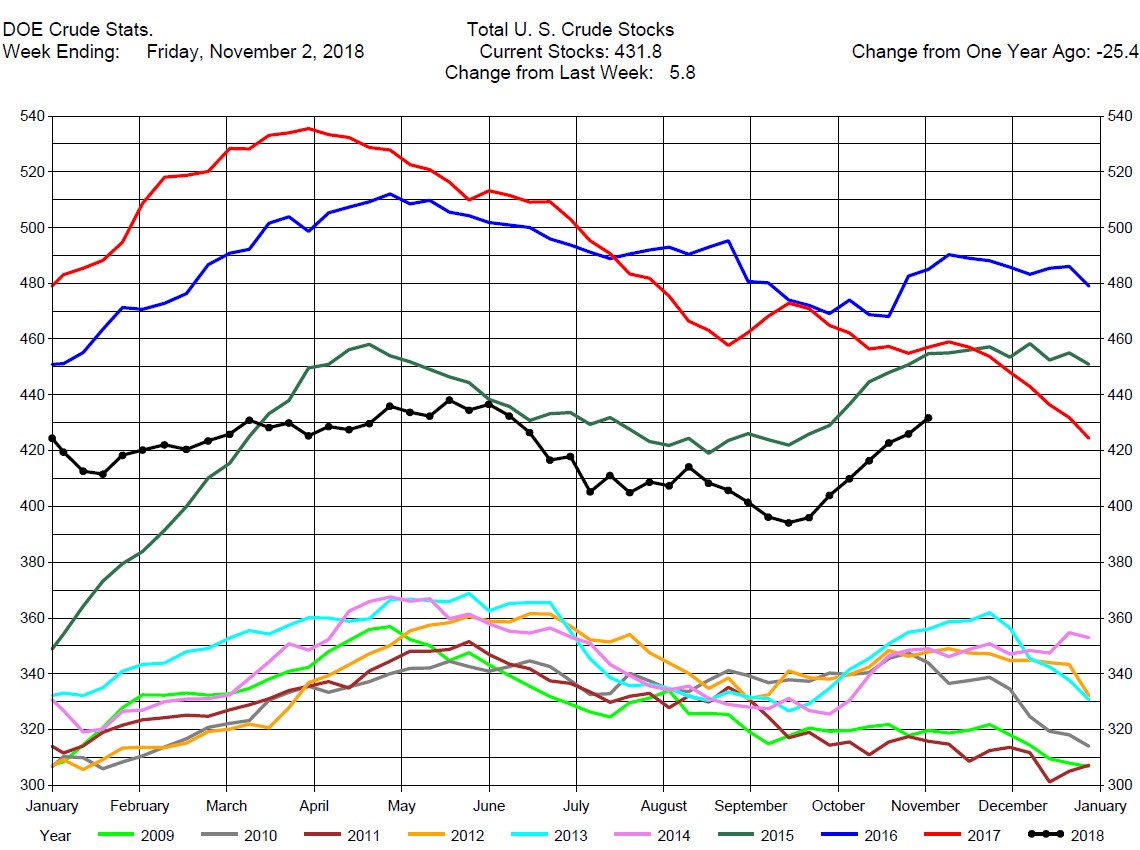
Crude oil prices have collapsed since mid-October, dropping from $77.00 to below $58.00 (Chart 1). Several factors have contributed to this historic drop in prices. US crude oil stocks have increased in the last seven weeks (Chart 2, black line). OPEC and Russia have increased crude oil production and appear unwilling to cut production until 2019. The Iranian sanctions are not reducing world supply as export waivers have been granted to several of Iran’s largest customers, such as China, India, and Japan. And the slowing growth of global crude oil demand as well as the stronger dollar have all pressured crude oil prices. We suggest consideration of short positions in the crude calendar spreads or outrights as well as shorting the gasoline cracks.
Chart 1
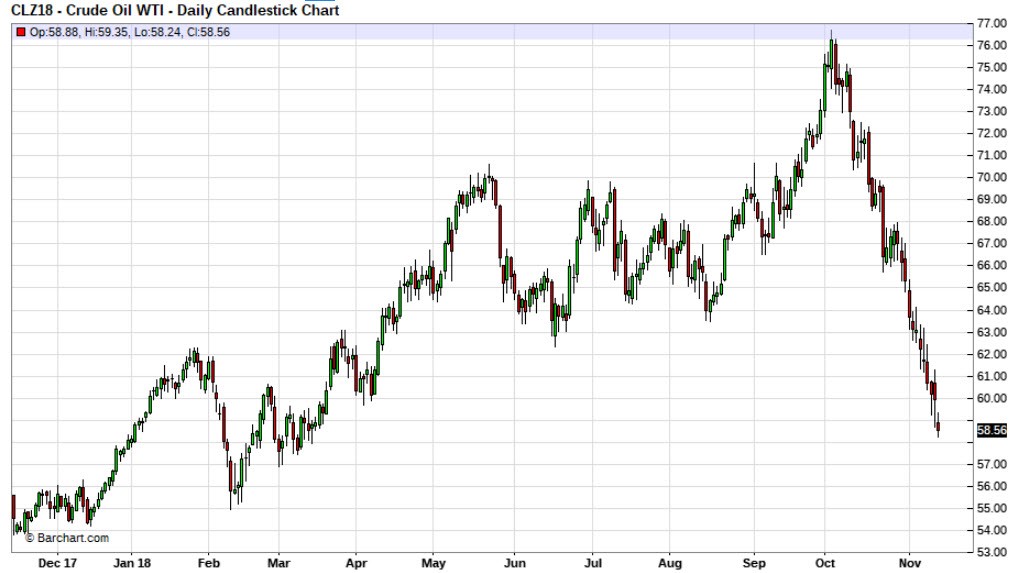
Chart 2
In stark contrast to crude oil, natural gas prices in the last week have dramatically increased in price from $3.50 to over $4.00 (Chart 3).
Chart 3
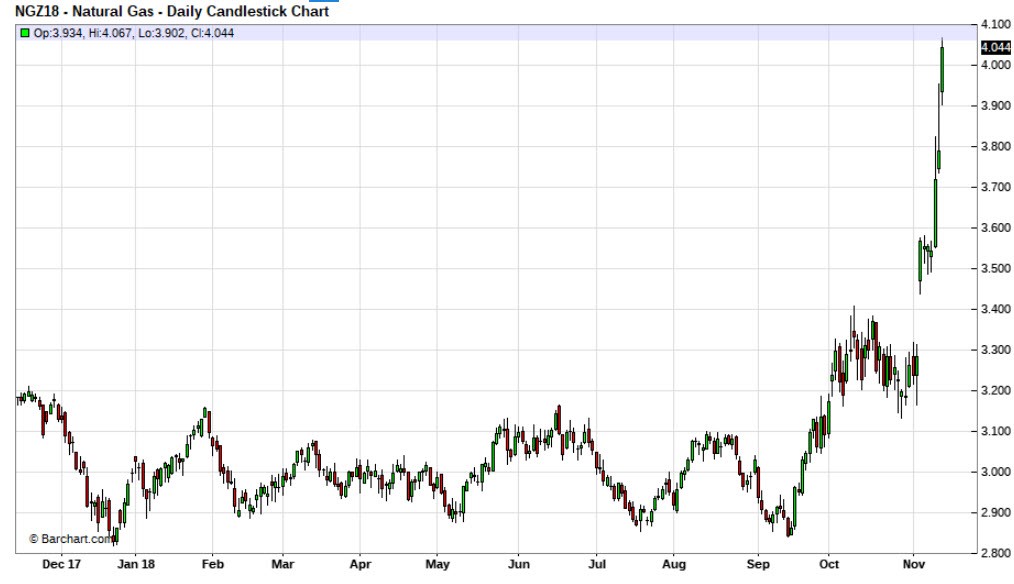
Lower storage inventory and unseasonably colder weather are the major factors contributing to the dramatic jump in prices. Natural gas storage at the end of the Injection Season is at a 12-year low (Chart 3, black line) of 3,200 bcf.
Chart 4
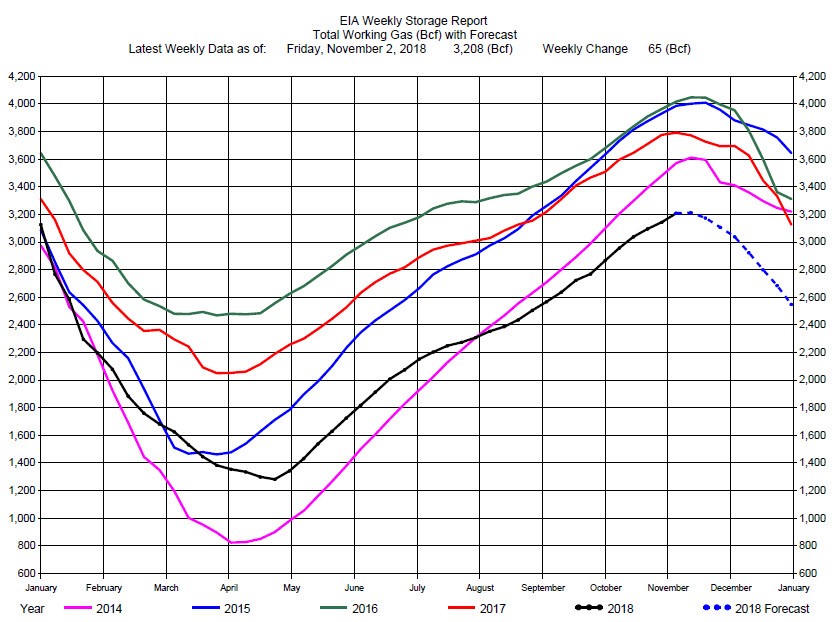
A Fundamental Analytics computer model storage forecast for the remaining seven weeks of the year (Chart 3, blue dashed line) projects storage remaining at record lows. Should the winter weather be colder than normal it would not be unexpected for prices to reach the $5 to $6 level.
We recommend consideration of long positions in the natural gas calendar spreads or outrights.
Grains
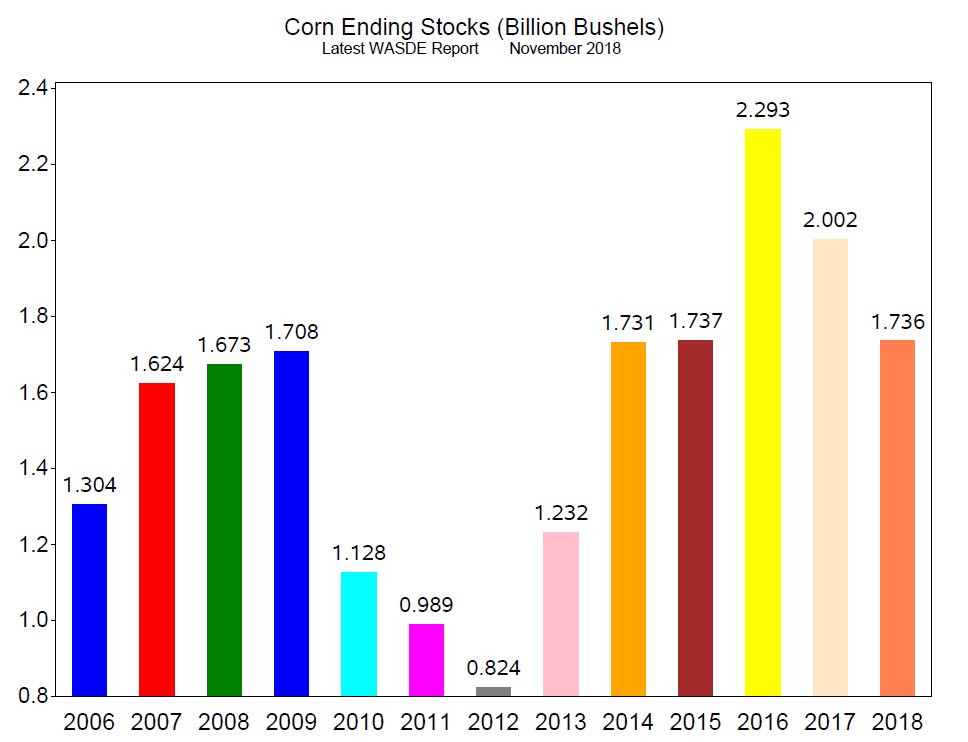
The USDA WASDE November report was released last Thursday. Regarding Corn, the November WASDE reported 178.9 bushels per acre (Chart 5, 2018) and the average estimate for the November report was 180.0 bushels per acre. Corn Production was reported at 14.63 bushels and average estimate was for 14.72 bushels (Chart 6, 2018). Corn Ending Stocks in the report was 1.736 billion bushels (Chart 7, 2018) and the average estimate was for 1.77 billion bushels. The reported numbers were all below estimates which are generally supportive of prices.
Corn prices have recovered from the lows in mid-September, but remain range bound. We cannot recommend consideration of a long position at this time but believe there is upside potential if prices break out of the current trading range and trade above $3.80.
Chart 5
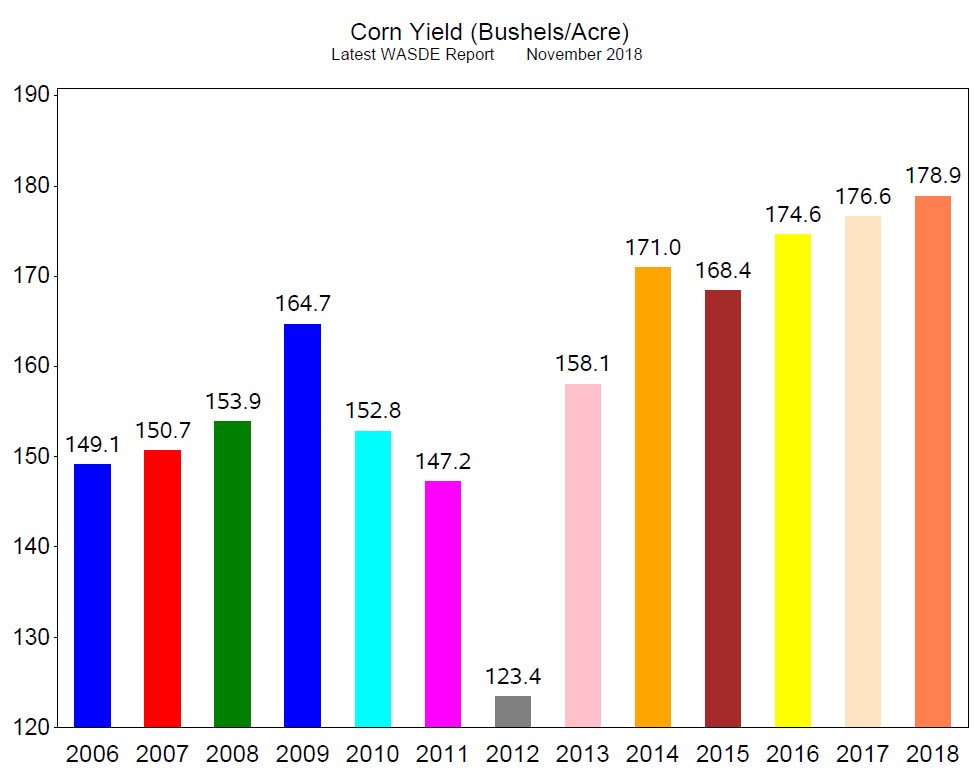
Chart 6
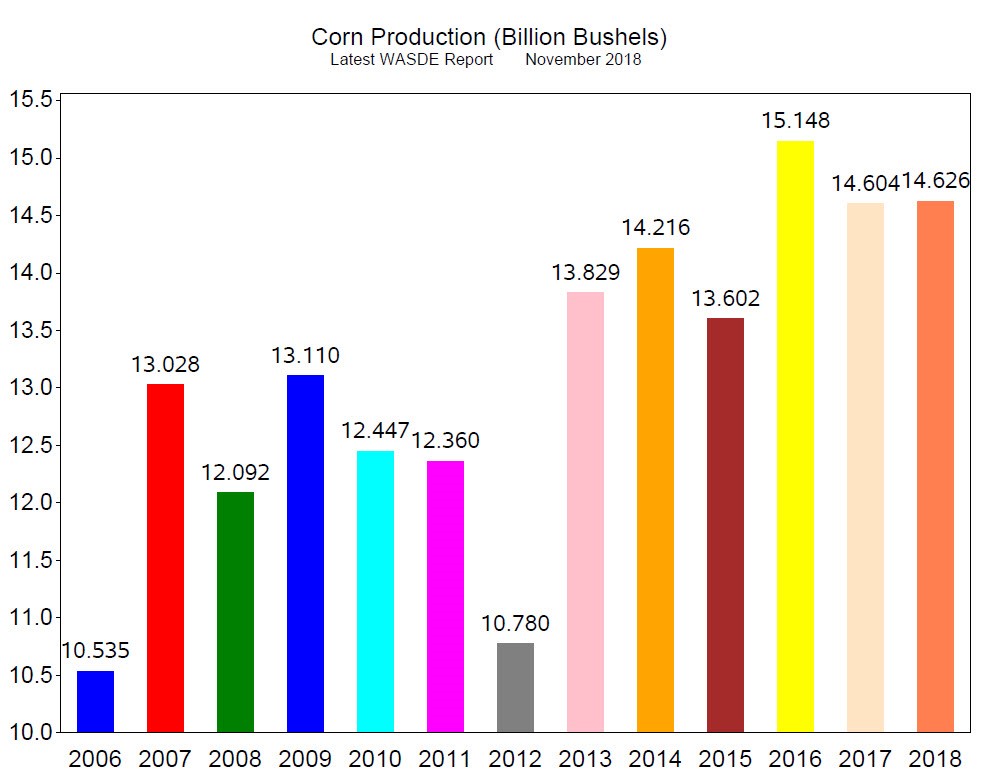
Chart 7
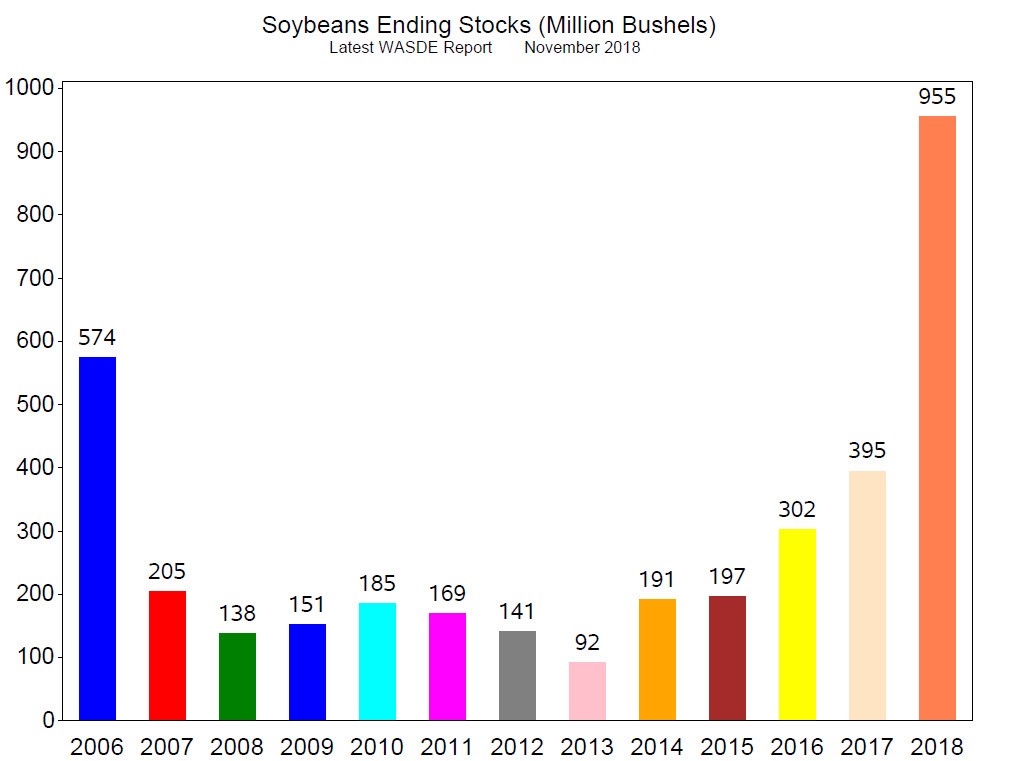
The November WASDE reported Soybeans Yield at 52.1 bushels per acre (Chart 8, 2018). The average estimate for the report was 52.9 bushels per acre. Soybeans Production was reported at 4.60billion bushels (Chart 9, 2018). The average estimate was for Production at 4.68 billion bushels. Ending Stocks was reported at 955 million bushels (Chart 10, 2018) while the average estimate was for 898 million bushels. The large increase in Ending Stocks was a surprise and the market traded down with the release of the report.
The data are bearish for soybeans prices, especially the Ending Stocks. Soybean prices recovered from the lows in September, but we do not believe higher prices can be sustained. As we have mentioned before, the Chinese tariffs have caused exports to China to drop from over 30 metric tons per week in July and August to 1.2 metric tons per week in September and October; soybeans in US storage are piling up. Consequently, we recommend consideration of short positions in the outrights or spreads.
Chart 8
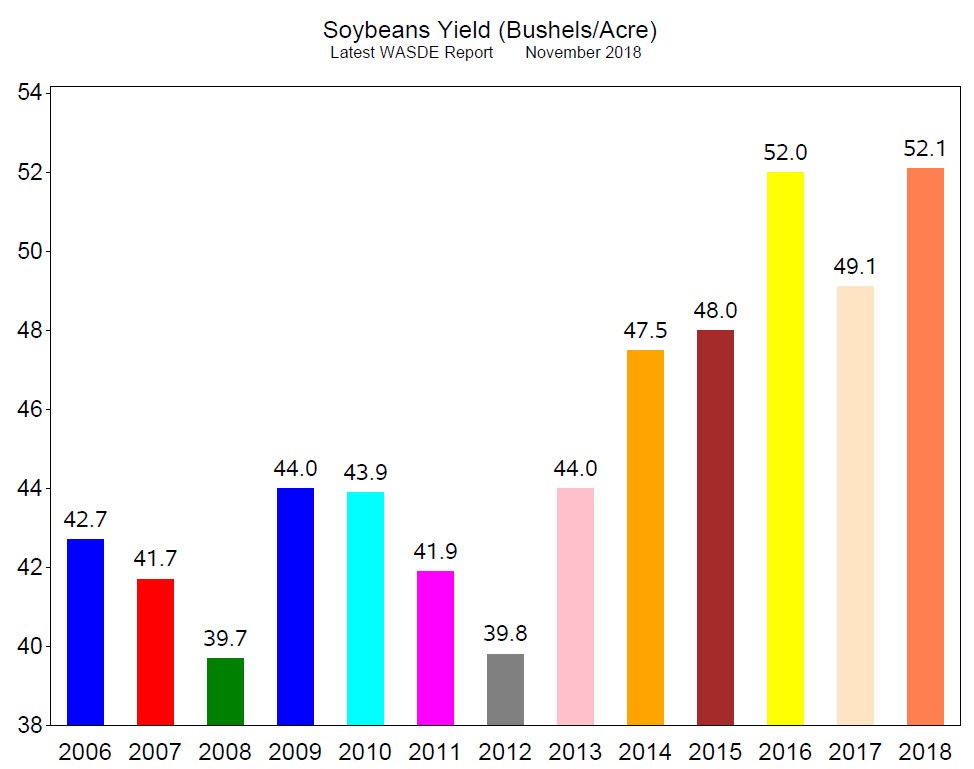
Chart 9
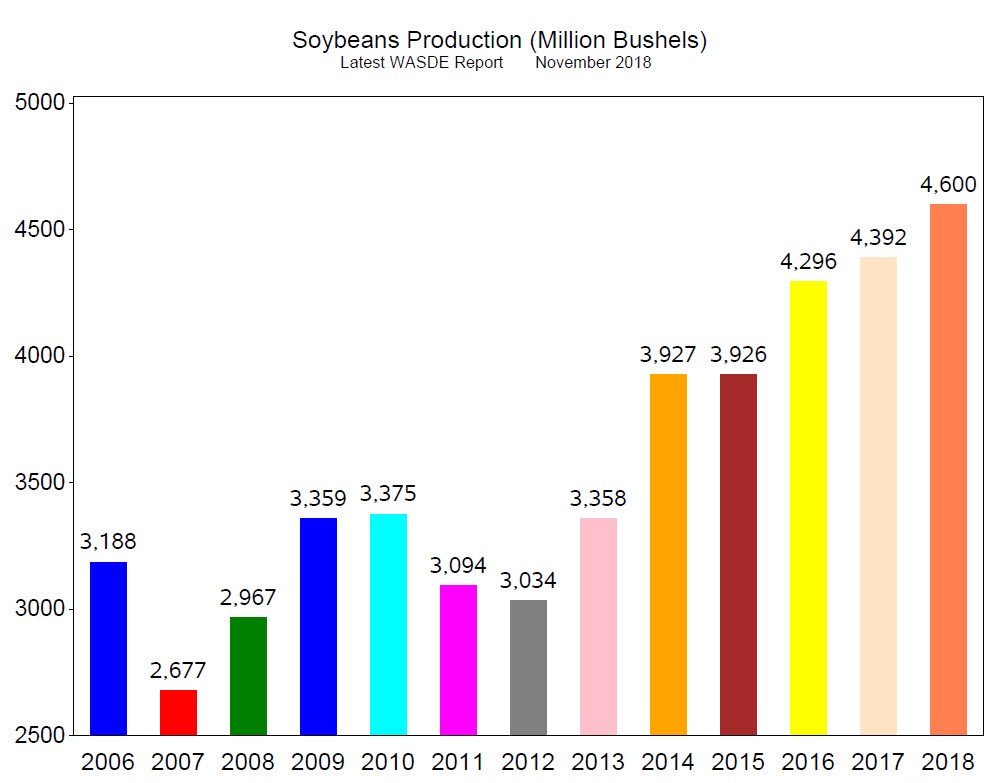
Chart 10
For more information contact joel.fingerman@fundamentalanalytics.com