Commodity Market Update September 12, 2018
Energy
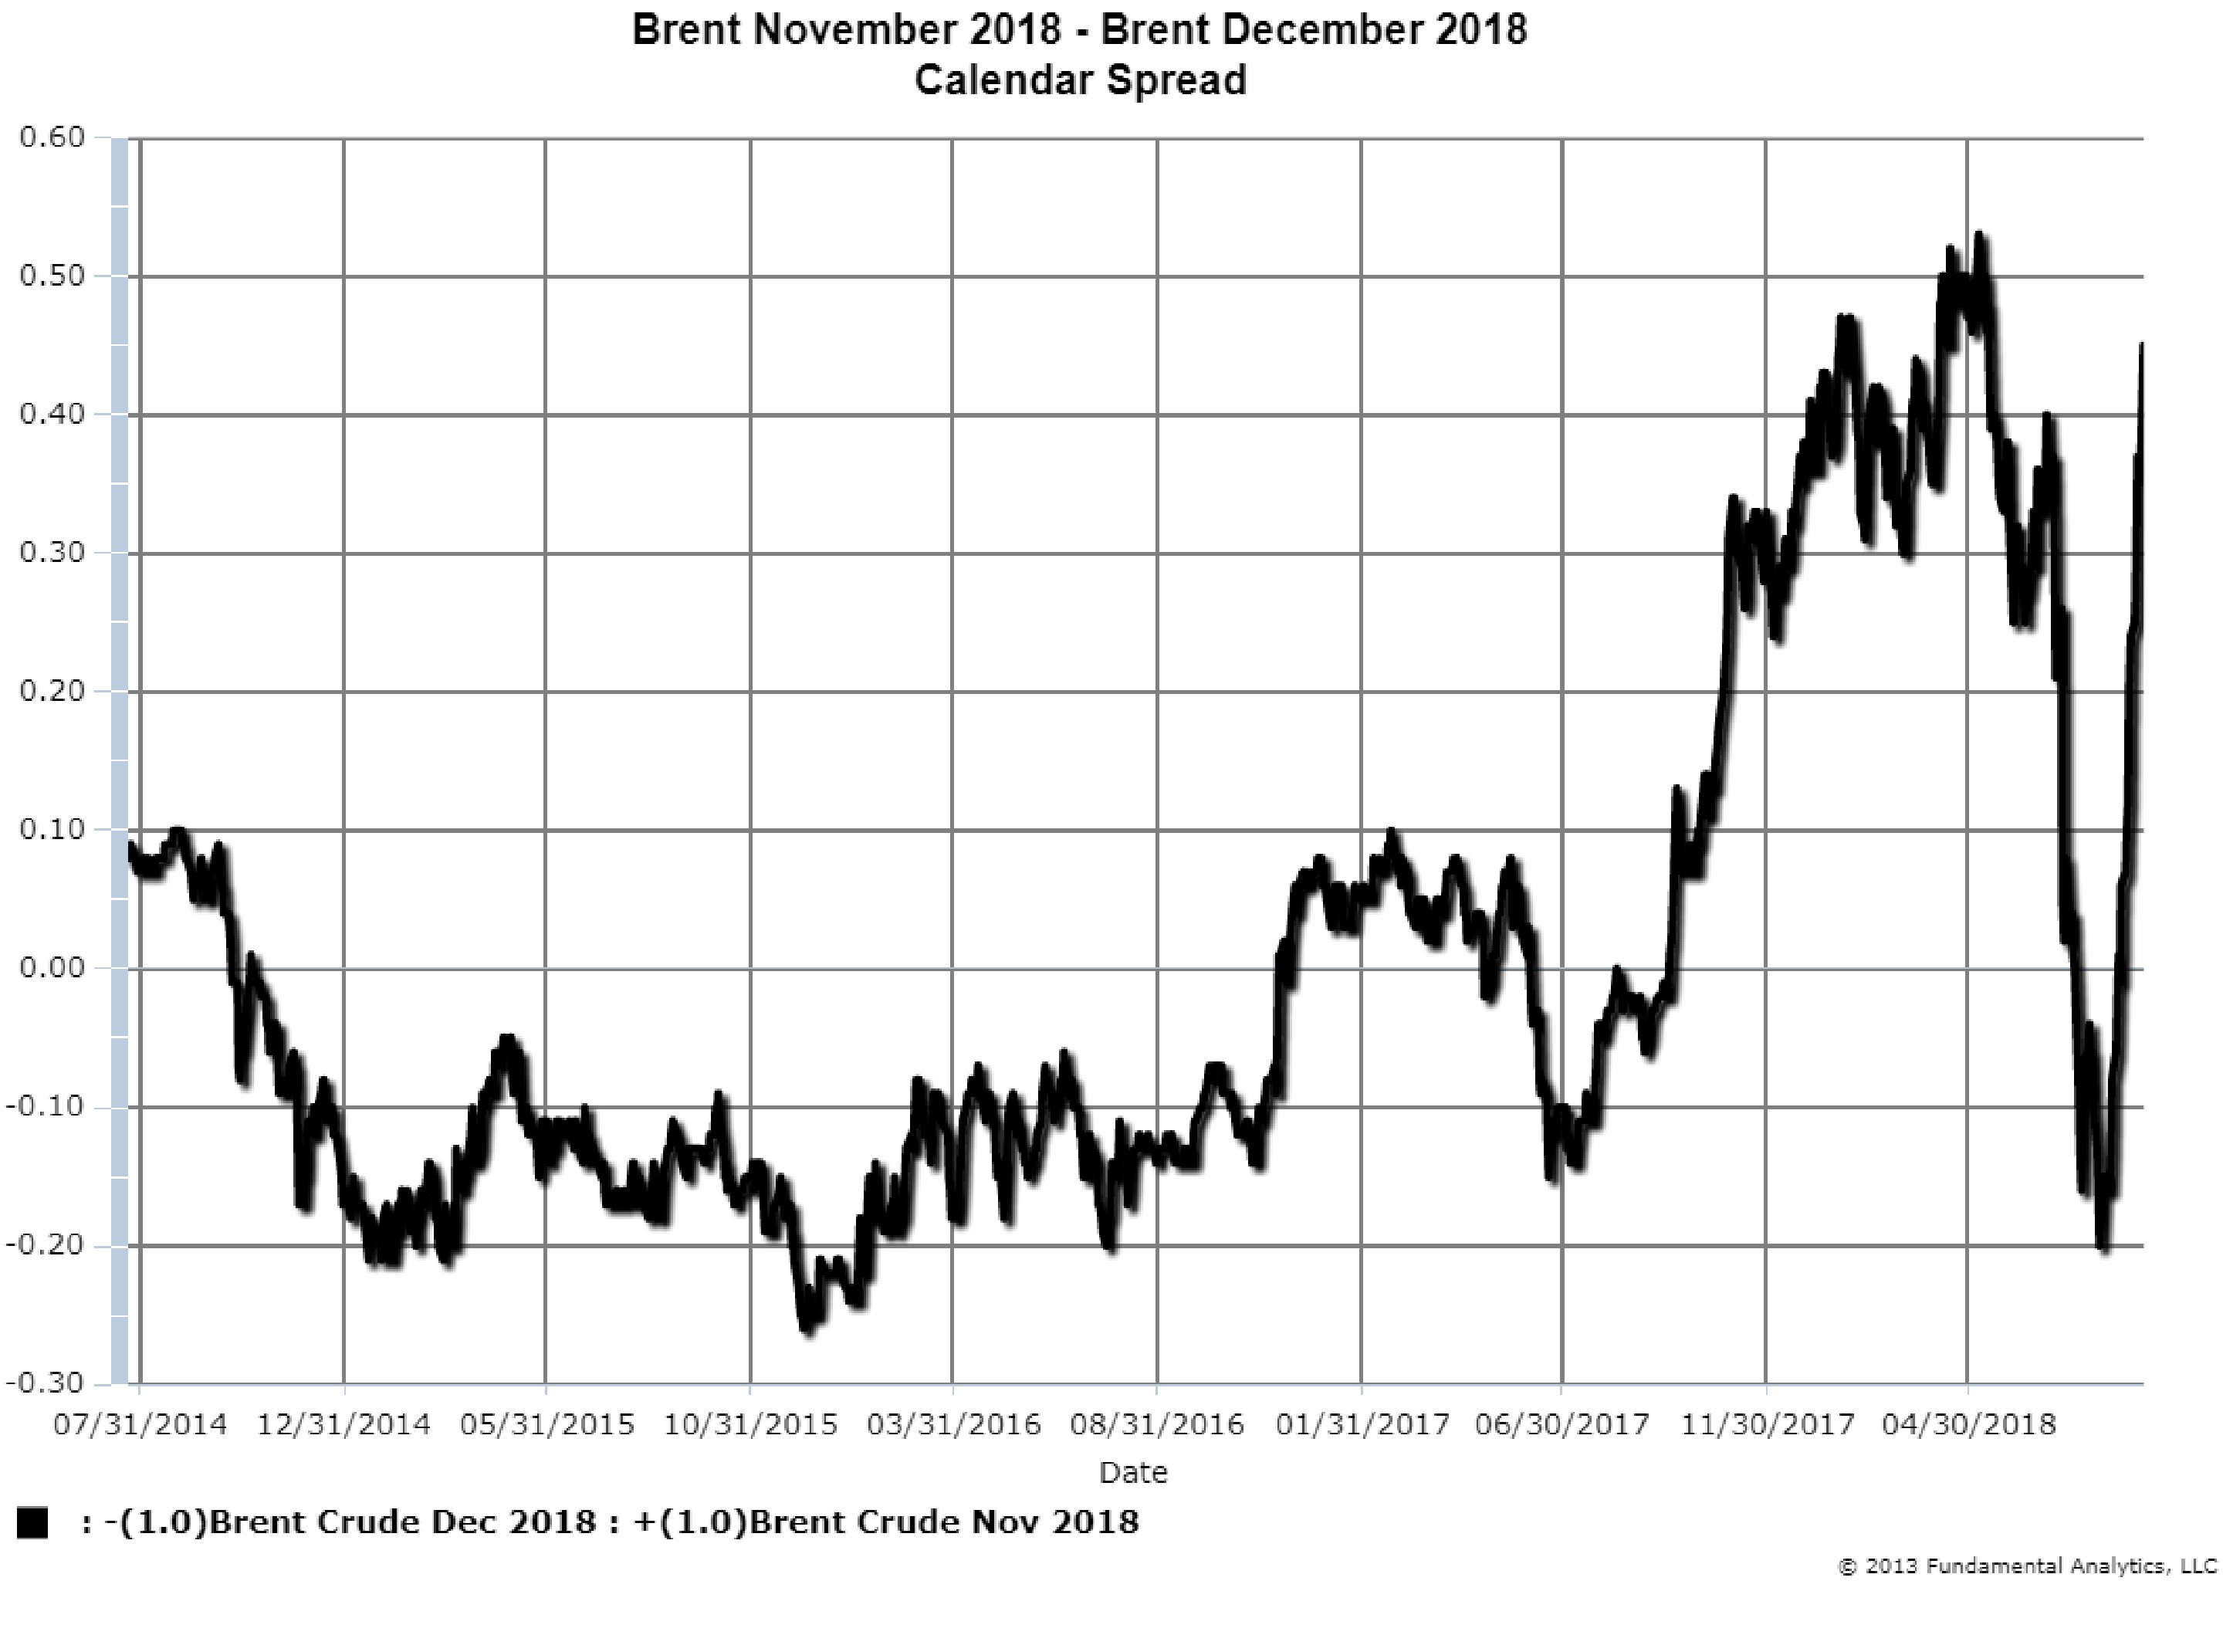
The forward curve of Brent Crude , the European Crude Oil benchmark, has recently moved out of contango (where the deferred months are higher priced) to backwardation (where the deferred months are lower priced). This is reflected in the Brent November – December calendar spread where positive values denote a backwardated market and negative vales denote a contango market (Chart 1).
As recently as August 8, 2018, when the market was in contango, the spread was-20 cents. The December contract was 20 cents greater than November. As of September 10, 2018, with the market in backwardation, the spread was +45 cents with November greater than December. This dramatic reversal means traders now view the market as potentially under-supplied and higher prices are anticipated..
Earlier in May when the US placed sanctions on Iranian crude oil exports (with greater sanctions to come in November), the November-December spread was over 50 cents. Then, when OPEC and Russia announced increases in crude production, the market collapsed and the spread dropped to -20 cents.
In recent weeks the spread became positive because of fears of lack of sufficient crude oil supplies from Saudi Arabia and a leveling off of US production. If OPEC, Russia, and the US cannot make up for the loss of Iranian crude, then the spread will increase as prices rise. On the other hand, if increased production replaces lost Iranian crude, then the market will be considered sufficiently supplied and prices will fall along with the November-December Brent spread.
As shown in the November-December spread, oil traders currently view that the market will be short of crude.
Chart 1
Grains
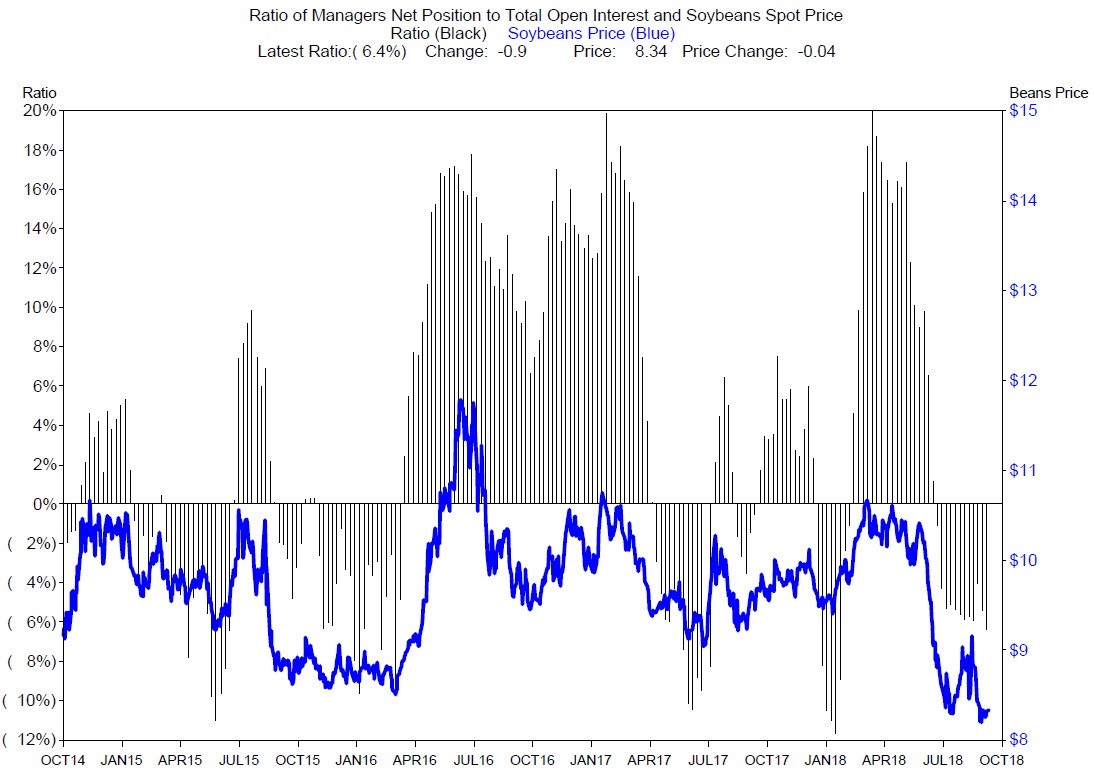
Chart 2 plots the futures price of soybeans (blue line measured by the right axis) and the ratio of managers net position in soybeans to total open interest in soybeans (gray bars, measured in percent, left axis). For the week ending Tuesday, September 4, 2018, the percent net short was -6.4% (last grey bar, pointing down). This means the Funds were net short 6.4% of the total open interest. Soybeans prices are still falling and the funds are getting shorter. Funds tend to extend a move in prices, and with the expectation of large ending stocks and tariff impacts prices are pressured. We suggest consideration of shorting the Soybeans November – January calendar spread.
Chart 2
For more information contact joel.fingerman@fundamentalanalytics.com