Dr. Ken Rietz
Last week, I looked at forecasts for LNG mostly from the supply side, but that is only half of the story. This week, I will fill out the rest by looking at the forecasts for LNG from the demand side. I will be using the same sources: the report from the International Energy Agency (IEA), World Energy Outlook 2023, and the report that the Independent Commodity Intelligence Services (ICIS) published this year, 2050 Global LNG Outlook. But first, we look at the graph of US LNG exports from 2023 to the present, as something of a proxy for global (ex US) demand for LNG.
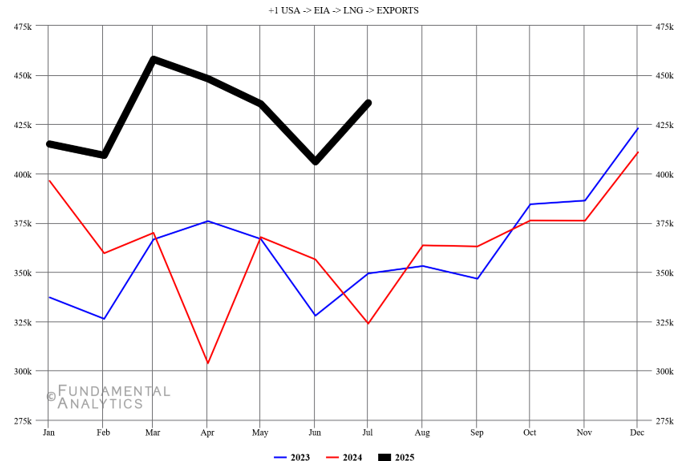
Figure 1: Millions of cubic feet of LNG exported from the US, monthly; source: EIA
The graph clearly indicates that the demand for LNG is increasing. This is particularly true in Europe, which is trying to reduce its energy dependence on Russia.
We now begin our summary of the forecasts from IEA and ICIS, in each of the time frames 2025– 2030, 2030–2040, and 2040–2050.
2025–2030
The ICIS project says LNG will grow at 5% year-on-year for the next 5 years, which is very fast growth. Europe, in particular, will grow particularly fast for two reasons. First, they have determined to eliminate all Russian energy purchases by the end of 2027. That energy has to be found elsewhere, and LNG is one of the easiest ways to do that. Second, the EU wants to move to green energy as much as possible, and natural gas is the natural bridge to reduce carbon emissions. After 2027, the EU demand for LNG will drop, causing the price for LNG also to drop, while leading LNG demand from other places to increase, mainly in southern and southeastern Asia at first, and then from northeast Asia. This assumes that China continues to grow. The Southeast Asia market, however, is not going to grow fast enough to fill the decrease in demand from Europe.
The IEA sees differing results depending on the scenario. The scenarios are STEPS (the Stated Policies Scenario), APS (the Announced Pledges Scenario), and NZE (the Net Zero Energy by 2050 scenario). All three scenarios, however, have the same general outlook as the ICIS projections: increasing LNG demand until 2030 or so, hitting the maximum demand then. The main differences between the scenarios, however, show up later.
2030–2040
The next decade in the ICIS report sees a major drop in the rate of demand in Europe, due to its general reluctance to depend on external imports. Norwegian natural gas will remain a significant source for the EU. Northeastern Asia will drop even more, with China’s growth becoming nearly flat by the middle of the decade, and both Japan and North Korea doing only slightly better. Southern and southeastern Asia will see a 5–6% annual increase in demand, but the amount of their demand is a lot smaller than Europe or China. Africa and the Middle East will experience about 4% annual demand growth. In general, this decade will see an oversupply of LNG and lower prices as a result.
The IEA scenario has the US, EU, and China seeing a long and even decline during this decade. The rates of decline are fairly slow for the STEPS scenario, but quite a bit faster for APS and much faster for NZE. The intention with NZE is to produce zero carbon emissions by 2050, so the rate of decline has to be larger. Yet, the IEA forecasts that new sources of natural gas will be found in this decade. For the rest of the world, generally the developing countries and emerging markets, the demand will continue growing in the STEPS scenario, and dropping in both of the remaining cases, NZE having the faster drop.
2040–2050
In the ICIS report, by the time that 2040 hits, the global amount of LNG should level off at a bit more than 600 million tonnes per year (mt/y), with almost no growth at all. The only regions with a growing demand for LNG are southern and southeastern Asia, where there will only be 3% annual growth. But by this time, the geopolitical uncertainties become potentially overwhelming.
In the IEA report, the trends from the 2030–2040 decade will continue. The STEPS scenario has an increase in demand, though slowing down. The APS and NZE scenarios show declines, with NZE dropping the fastest. Note that dropping to net-zero carbon emissions does not preclude needing natural gas, which is a natural precursor in manufacturing, especially plastics.
Trading
The combined trading advice from this commentary and the last one gives a green light to rising LNG prices for several years, then leveling off around 2027, and after that declining slowly for most of the rest of the time until 2050. Obviously, geopolitical or economic events would change these predictions, as would the discovery of new fields of natural gas. But the similarity in opinion between these two, very different, forecasts promotes a greater sense of confidence in the results.